Table of contents
Insights
Insights allow you to take a deep dive into your data.
You can explore what items are the most recommended, which categories of items are being interacted with thanks to recommendations, or what portion of views is based on previous successful recommendations.
Video Tutorial#
Library of Predefined Insights#
We have created a library of Insights covering frequently used analytical data views.
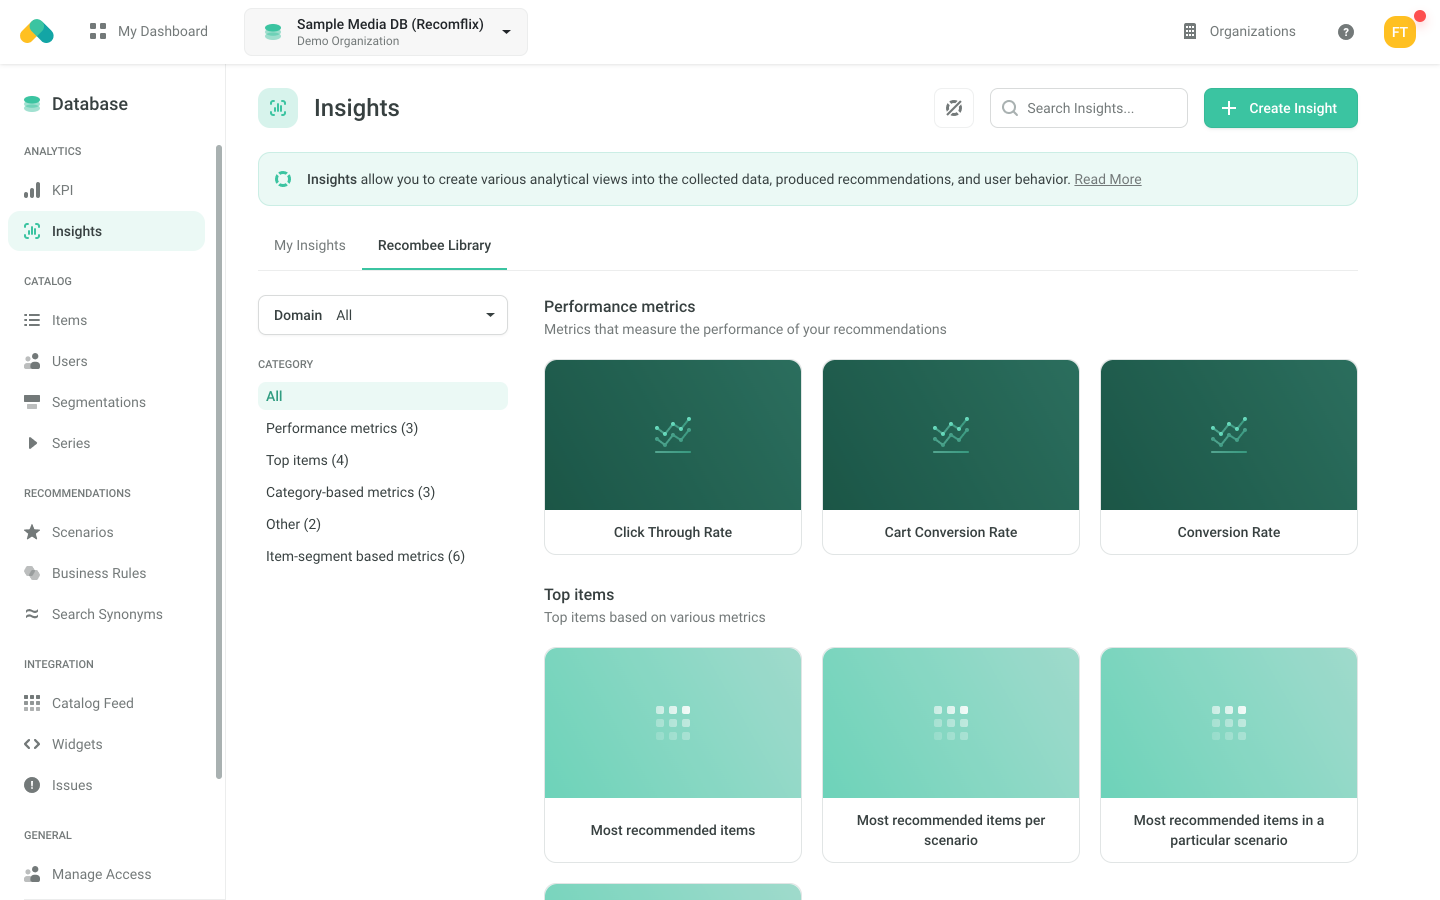
Predefined Insight Types#
For easier orientation we group the predefined Insights in the library into the following groups.
Performance metrics#
- Metrics such as Click Through Rate, Cart Conversion Rate, or Conversion Rate
Top Items#
- Insights showing the top items according to various metrics
- For example the most recommended items, the most recommended items, or the items that are the most clicked in the recommendation boxes
Category-based metrics#
- These Insights group the recommended or interacted items by their category item property
- You can therefore see which categories are the most interesting for users, either thanks to recommendations or in general
Item-segment based metrics#
-
Similarly to grouping by the category item property, you can also group the recommended or interacted items by any Items Segmentation that you use in your Database
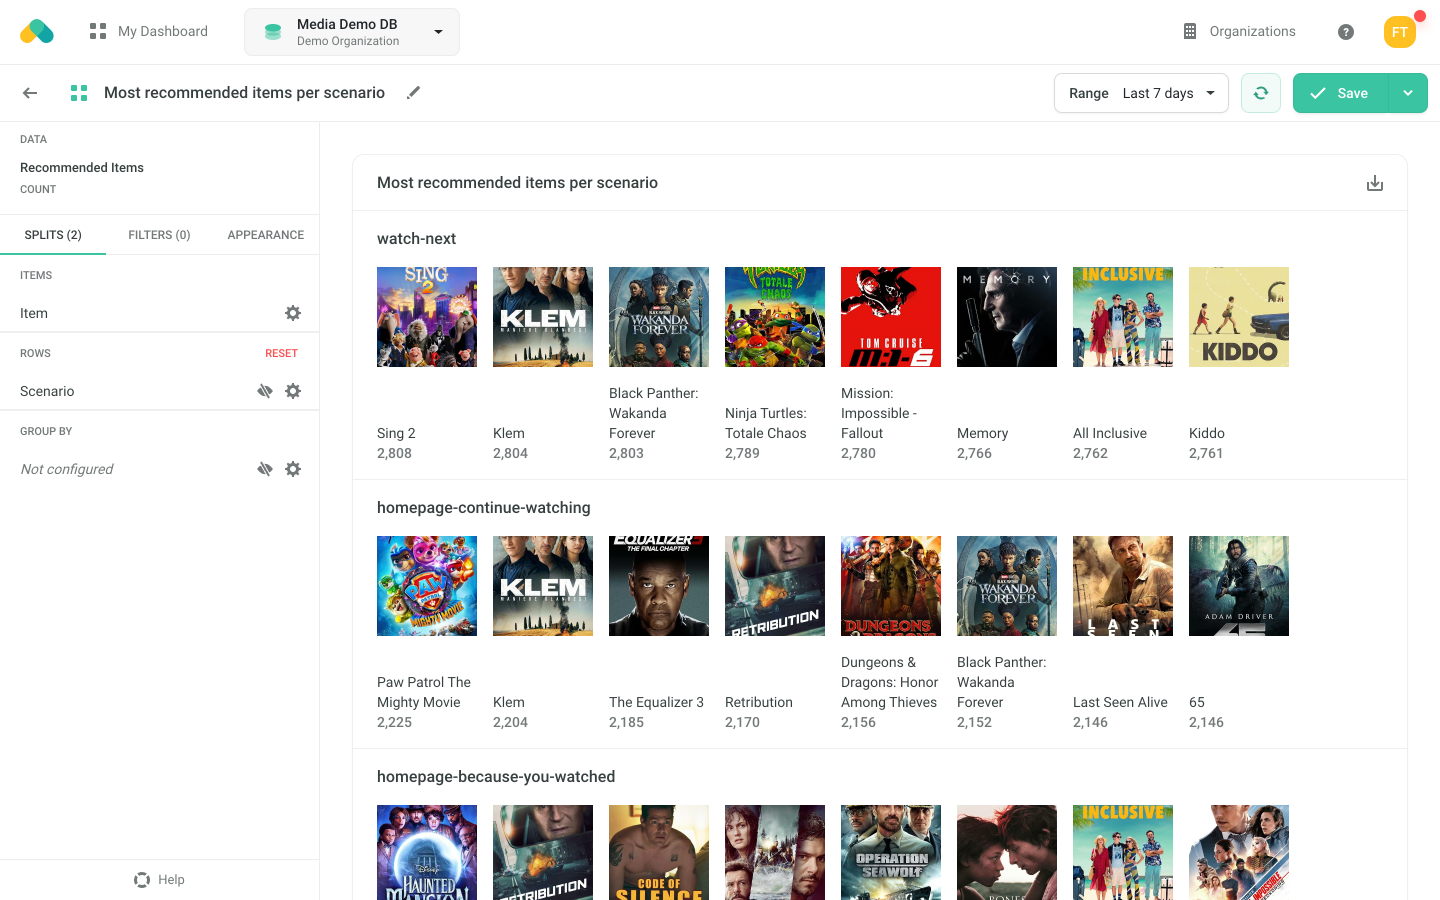 Top Items Insight with the most recommended items per scenario#
Creating Custom Insights#
One of the best ways to start with custom Insights is to duplicate an existing Insight from the library and change particular settings.
However, you can also start entirely from scratch by clicking the Create Insight button.
Insight Types#
You can choose from the following types of visualization.

Bar Chart

Line Chart

Area Chart

Table

Top Items
Shows a list of e.g., most recommended, interacted, or profitable items
Insights Settings#
There are three main settings:
Data Sources - What kind of data and what metric will be used (e.g., Count of Recommended Items or Sum of Price of Purchases Based on Recommendations).
Filters include only particular data in the result (e.g., show data only for a particular Item, for a particular Scenario, or for a category).
Splits break down the data by fields (e.g., by Scenario or per a property such as category).
Data Sources#
The Data Source describes the queried data and applied metric. Some examples can be the Count of Recommended Items or the Average price of Purchases.
It also defines what Filters and Splits can be applied - for example, recommendation requests can be filtered per a Scenario, while the Rating interactions can be filtered to positive or negative ratings based on the submitted value.
You can add multiple Data Sources to your Insight. If you add multiple Data Sources,then only the Splits that are applicable to all the Data Sources can be added.
Available Data Sources#
The available Data Sources can be categorized by their topic into the following 3 groups:
- Recommendations
- Interactions
- Interactions Based on Recommendations
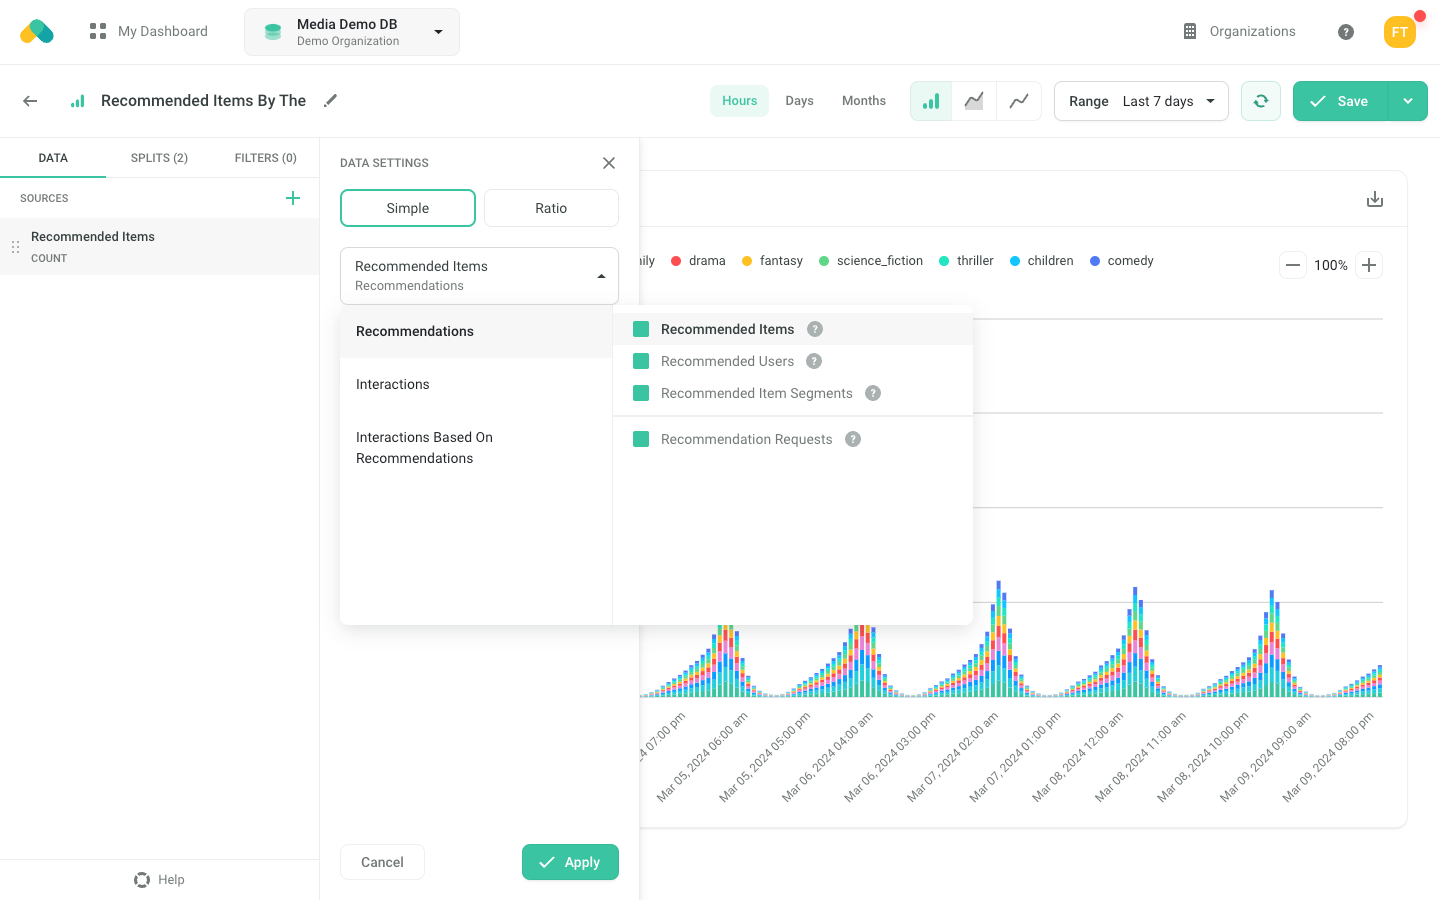
Picking a Data Source#
Recommendations Data Sources#
Data Sources from this category present data about:
- Recommendation Requests
- Recommendation requests sent to the Recombee API
- Based on the selected Metric, you can see for example the count of the requests or the number of distinct users that requested the recommendations
- Recommended Items / Recommended Users / Recommended Item Segments
- The individual Items / Users / Items Segments that were recommended
- Based on the selected Metric, you get for example the total count of recommended Items or the number of distinct recommended Items
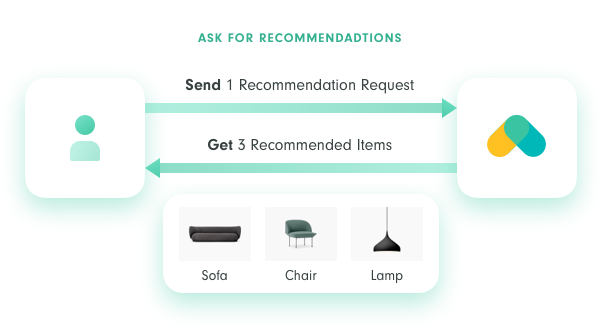
The difference between Recommendation Requests and Recommended Items#
Interactions Data Sources#
Data Sources in this category present data about ingested interactions.
- Individual interaction types: Detail Views / Ratings / Purchases …
- Interactions of a particular type
- All the Data Sources offer Metrics like count, count of distinct users, or count of distinct items
- Particular interaction types offer specific Metrics - for example, Purchases offer Price (with operators such as sum or maximum), while Ratings offer the value of the rating (so you can see e.g., average rating)
- All interactions
- Interactions of all types together
View Portions vs. View Portion Events
The View Portion Data Source aggregates the ingested View Portions by sent (User, Item, Session).
Therefore, if the user watches a video and you send 5 milestones to Recombee, it will still be counted as a single View Portion. This way, the View Portions are shown in the KPI console and counted in the All Interactions Data Source and also in pricing.
The View Portion Events Data Source contains each Set View Portion request sent to the API. Therefore, if the user watches a video and you send 5 milestones to Recombee, there will be 5 View Portion Events.
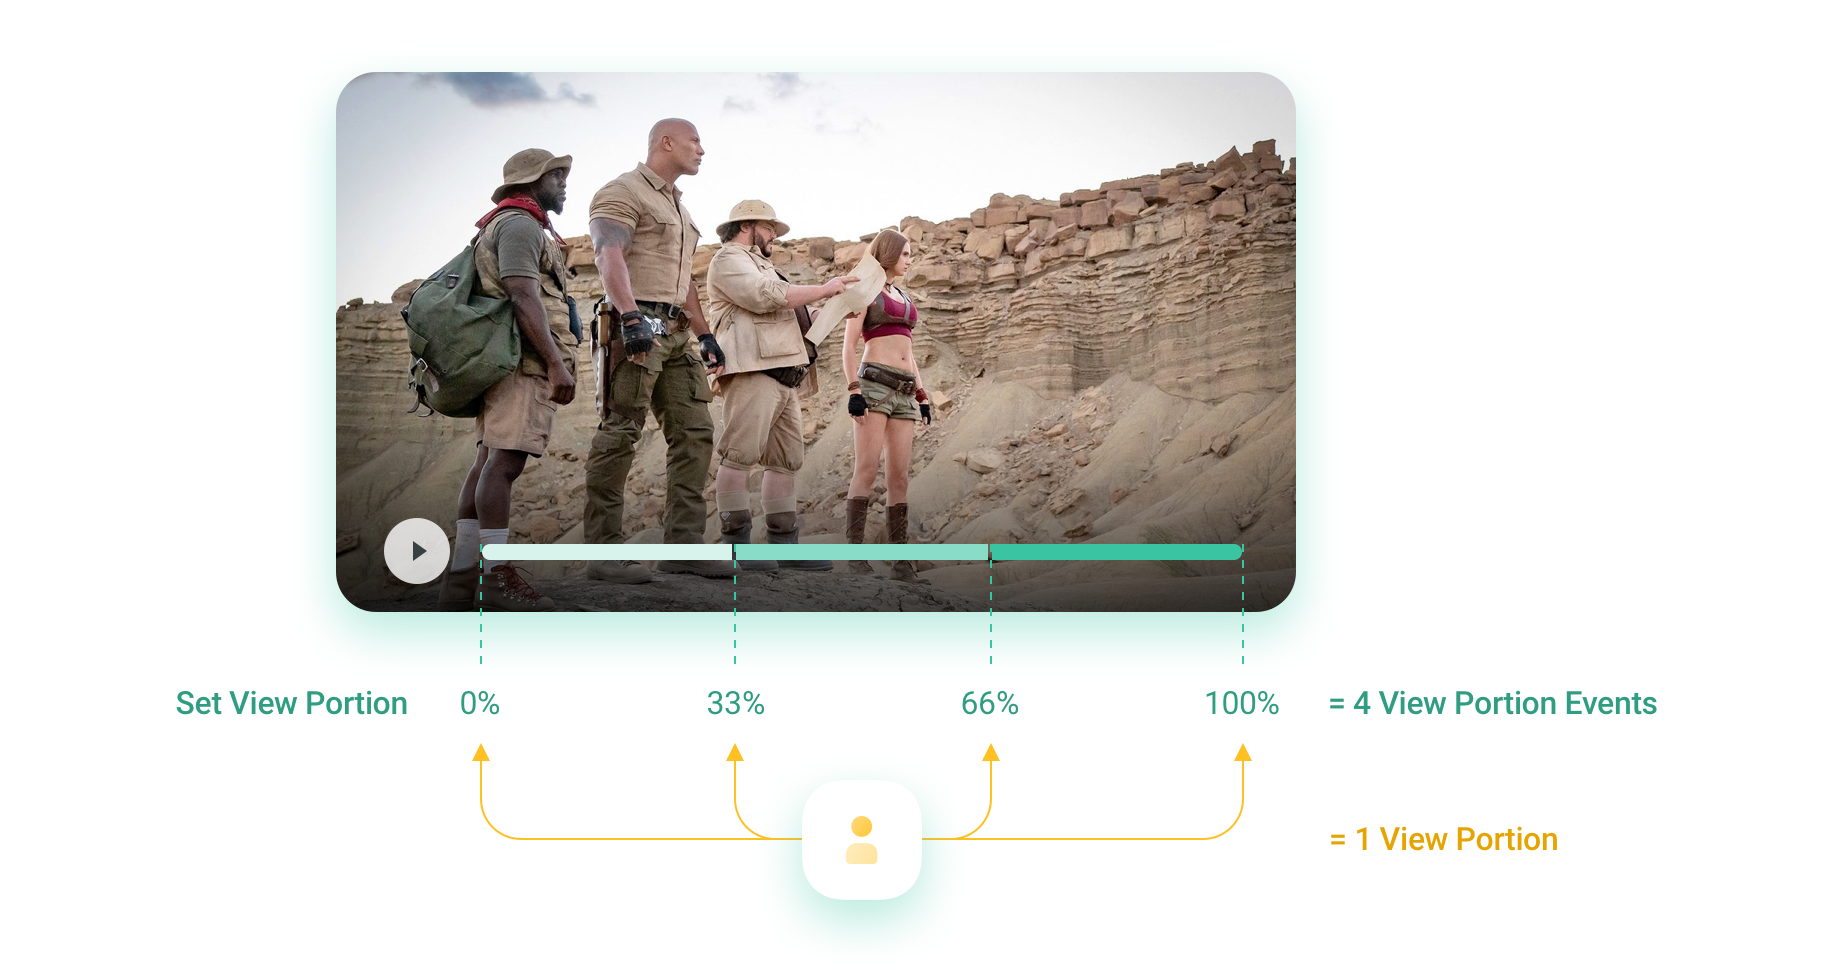
View Portion / View Portion Events comparison#
Interactions Based on Recommendations Data Sources#
Data Sources in this category present data about interactions that happened thanks to previous successful recommendations.
Their types follow the same pattern as Interactions.
You can see either Reported (based on sent recommId) or Estimated (based on time window) Interactions Based on Recommendations.
Ratio Data Sources#
When adding a Data Source, you can switch from a Simple Data Source, which shows a single metric, to a Ratio Data Source, which is a ratio of two Data Sources.
The Ratio Data Source can be used for showing various percentual metrics, such as:
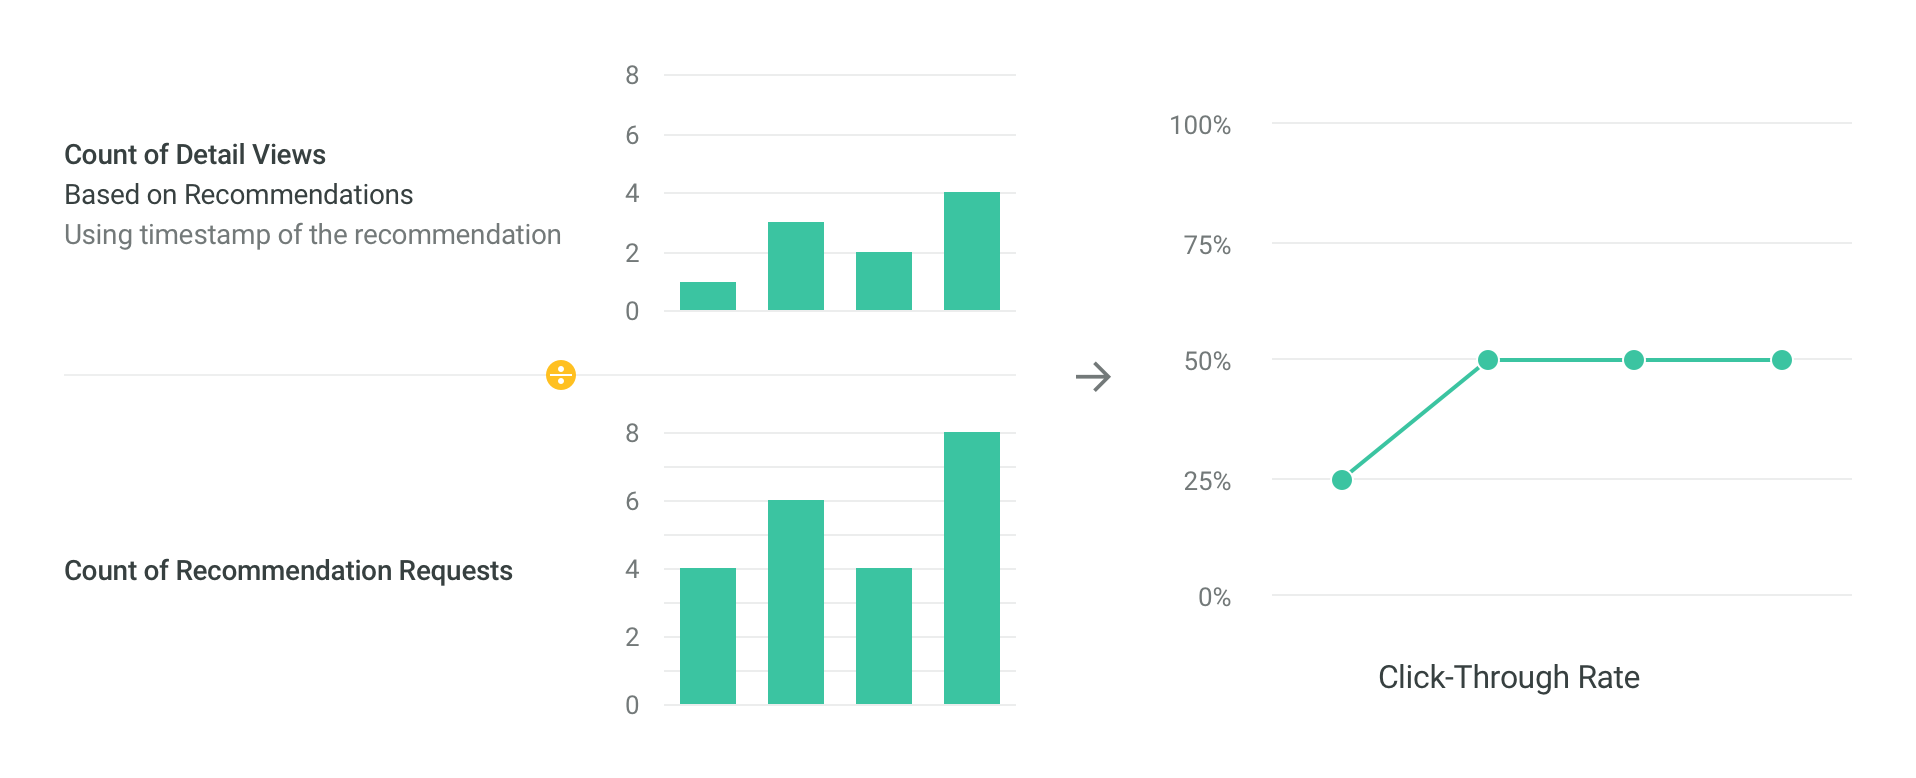
Click-Through-Rate
- Numerator - Count of Detail Views Based on Recommendations
- Denominator - Count of Recommendation requests
Ratio of profit from recommendations on the total profit
- Numerator: Profit of Purchases Based on Recommendations
- Denominator: Profit of all Purchases
Ratio of recommended items from a category on all recommended items
- Numerator: Count of Recommended Items with a Filter set to a particular category
- Denominator: Count of Recommended Items
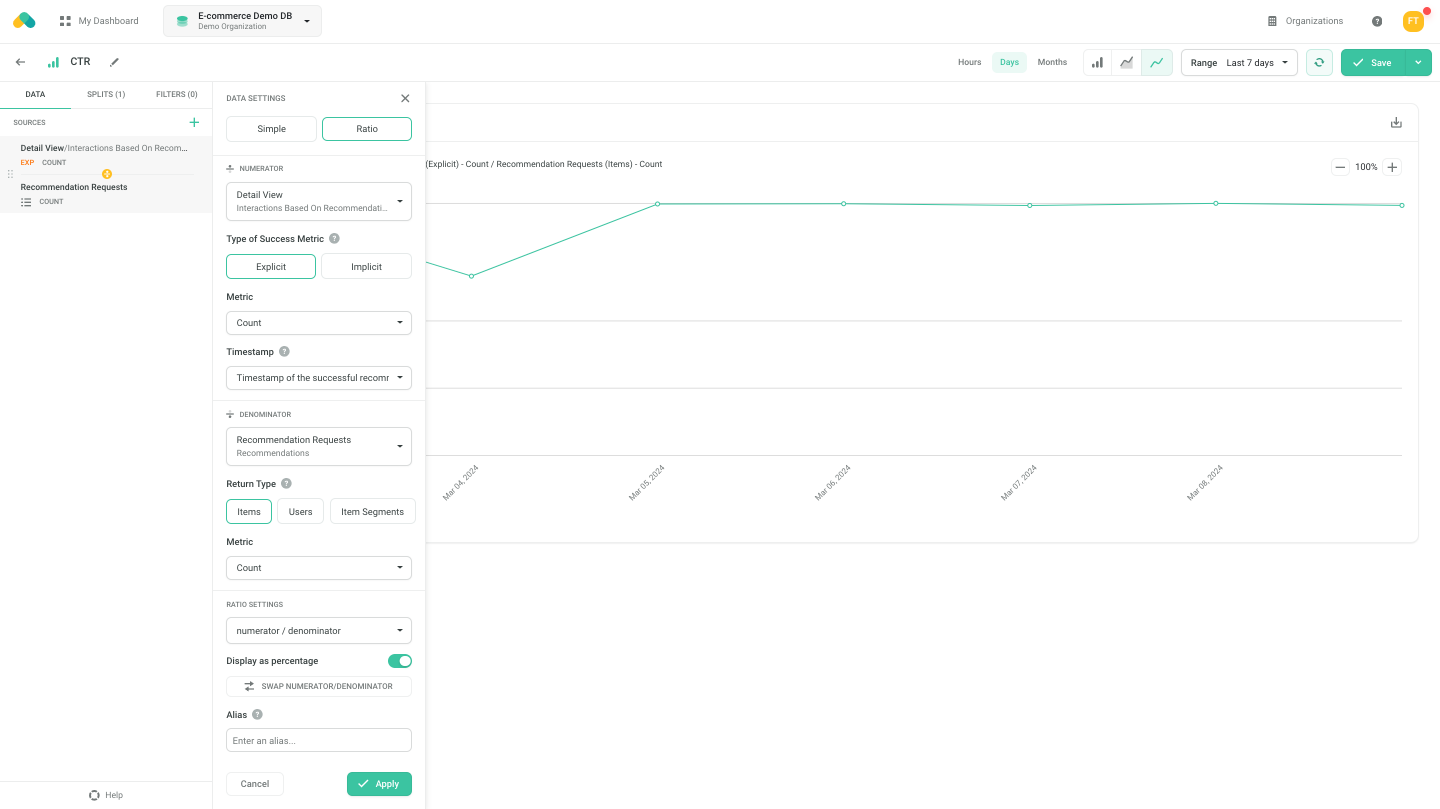
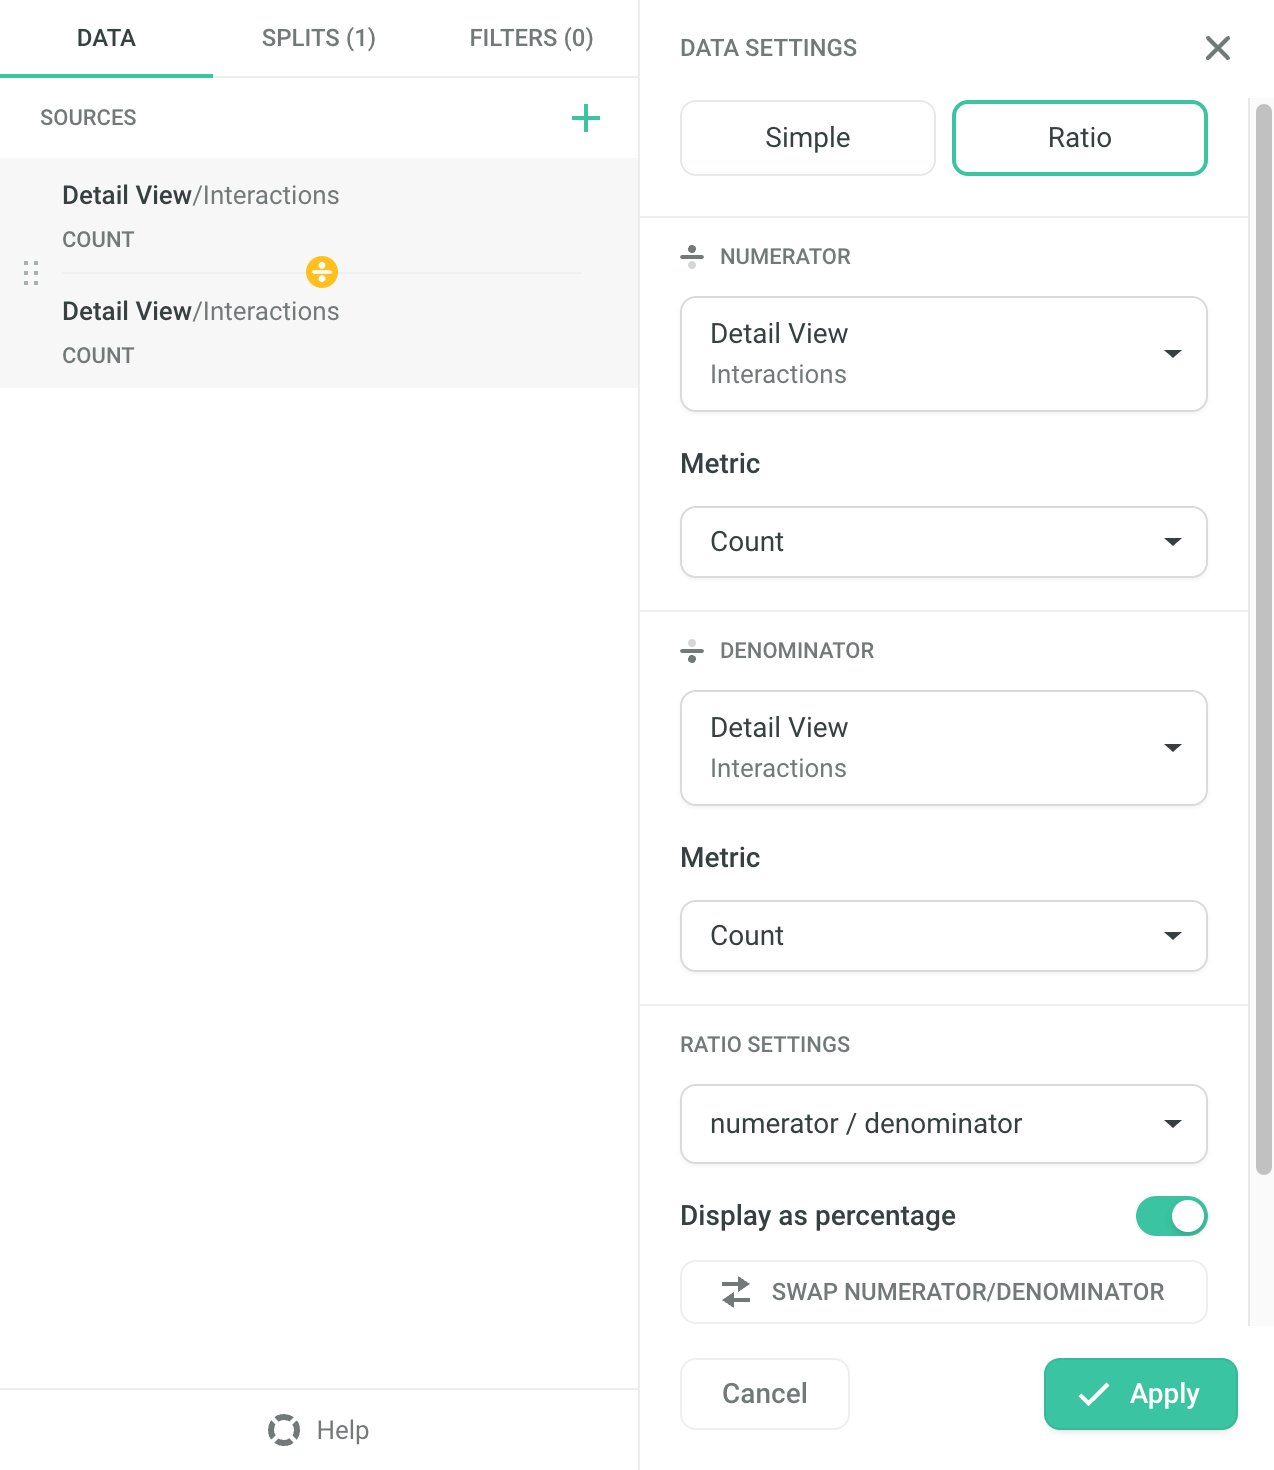
Example of setting up a Ratio Data Source#
Filters#
The Filters allow you to include only part of the data in the Insight, or exclude it.
You can see the data for example, only for a particular Scenario, for a particular User, or for a particular Segment of your data (e.g., one category).
You can either add a Filter in the Filters section or click on a value in the graph or table and choose to include it or exclude it.

Adding a Filter directly in the table#
Example - The CTR of a Scenario#
Add a Filter on a particular Scenario.

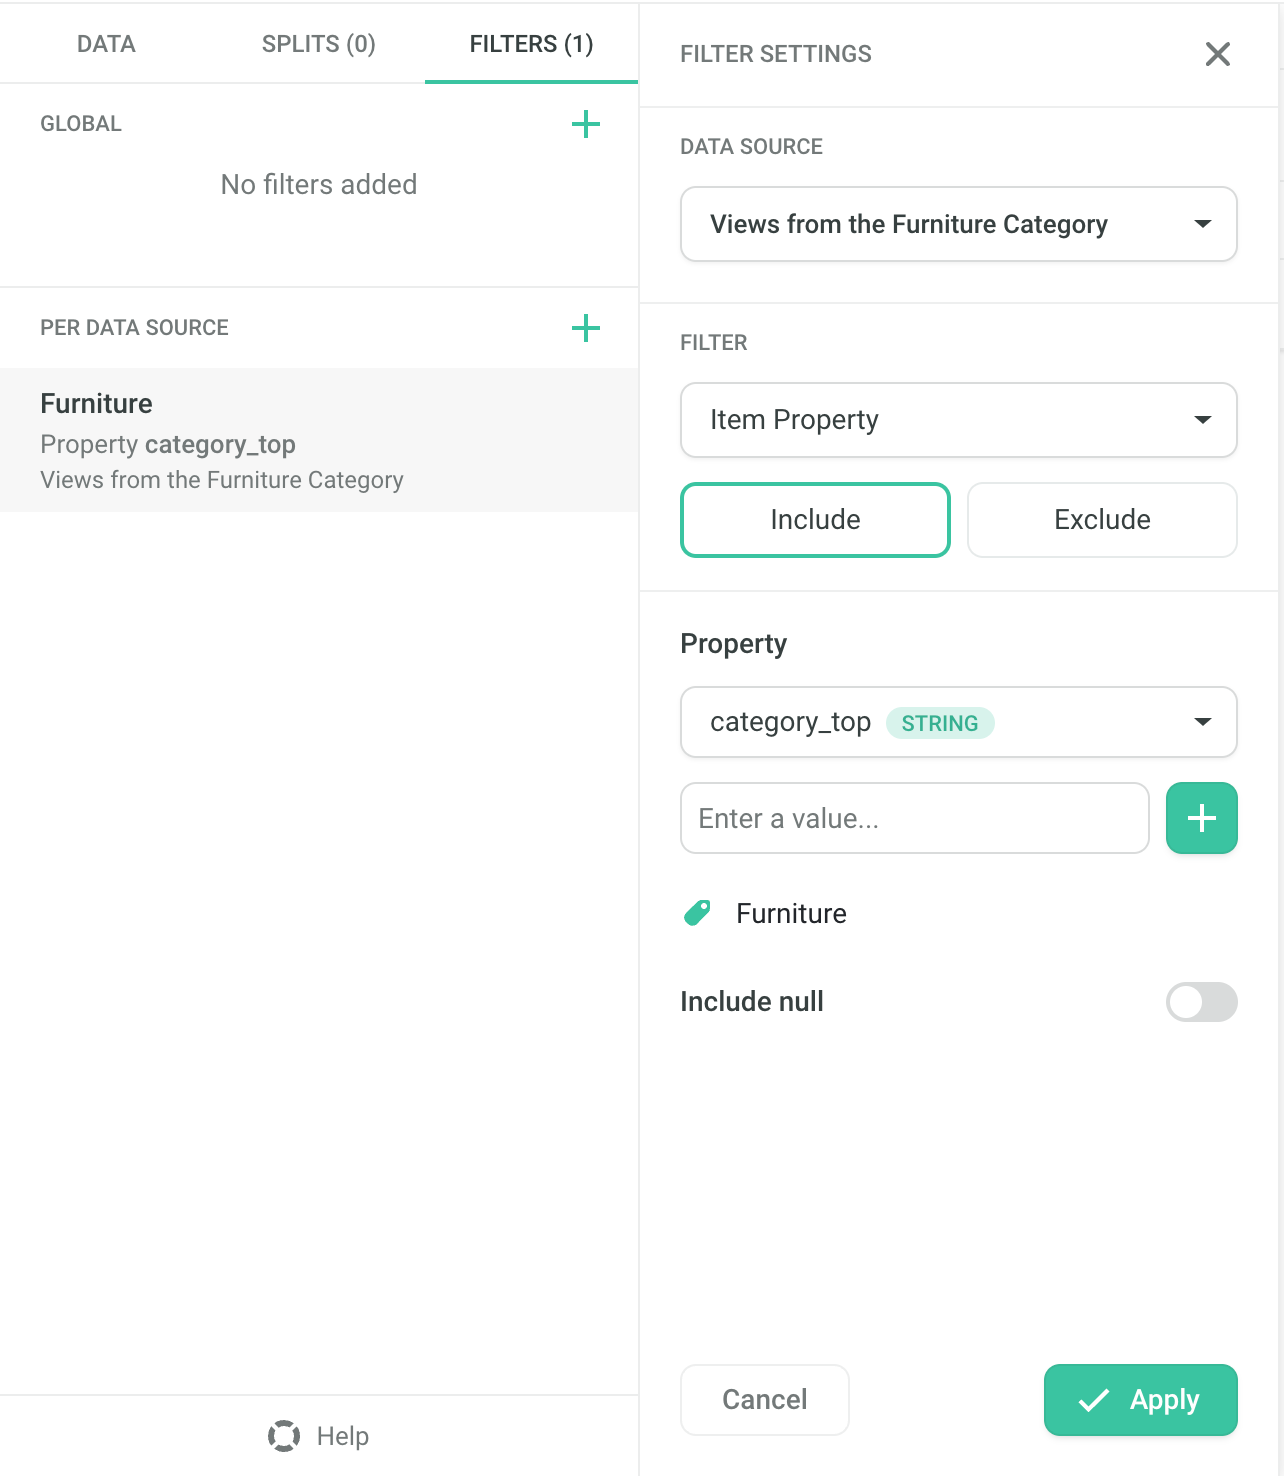
Example - The Most Recommended Items from a Category#
Add a Filter on an Item Property, choose the category property, and fill in the name of a particular category.

Data Source specific Filters#
By default, the Filters are applied to all the Data Sources. However, you can also add a Filter only to a particular Data Source.
In the case of the Ratio Data Sources, you can also choose whether to apply the Filter to both numerator and denominator or only one of them.
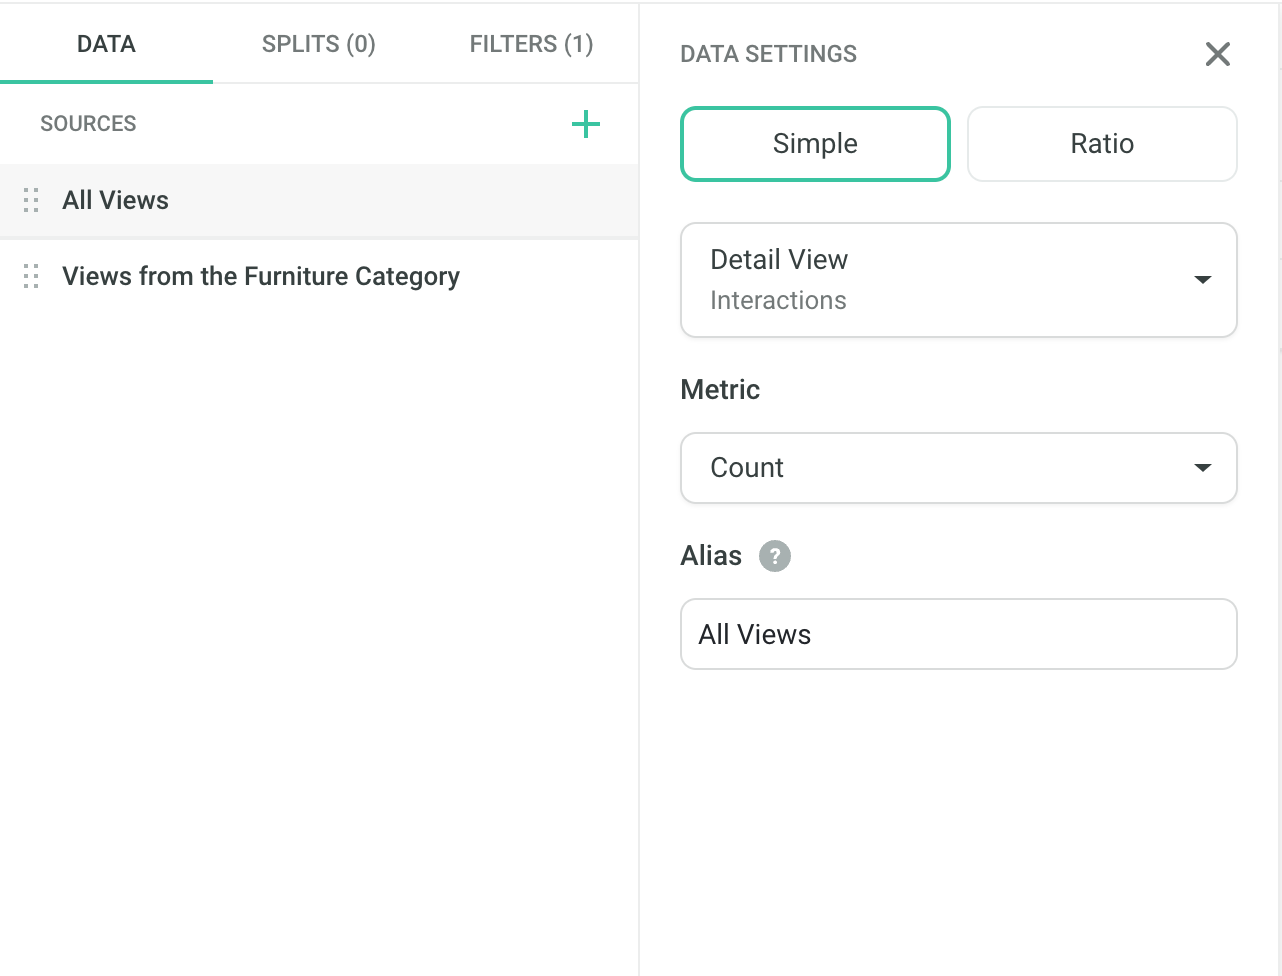
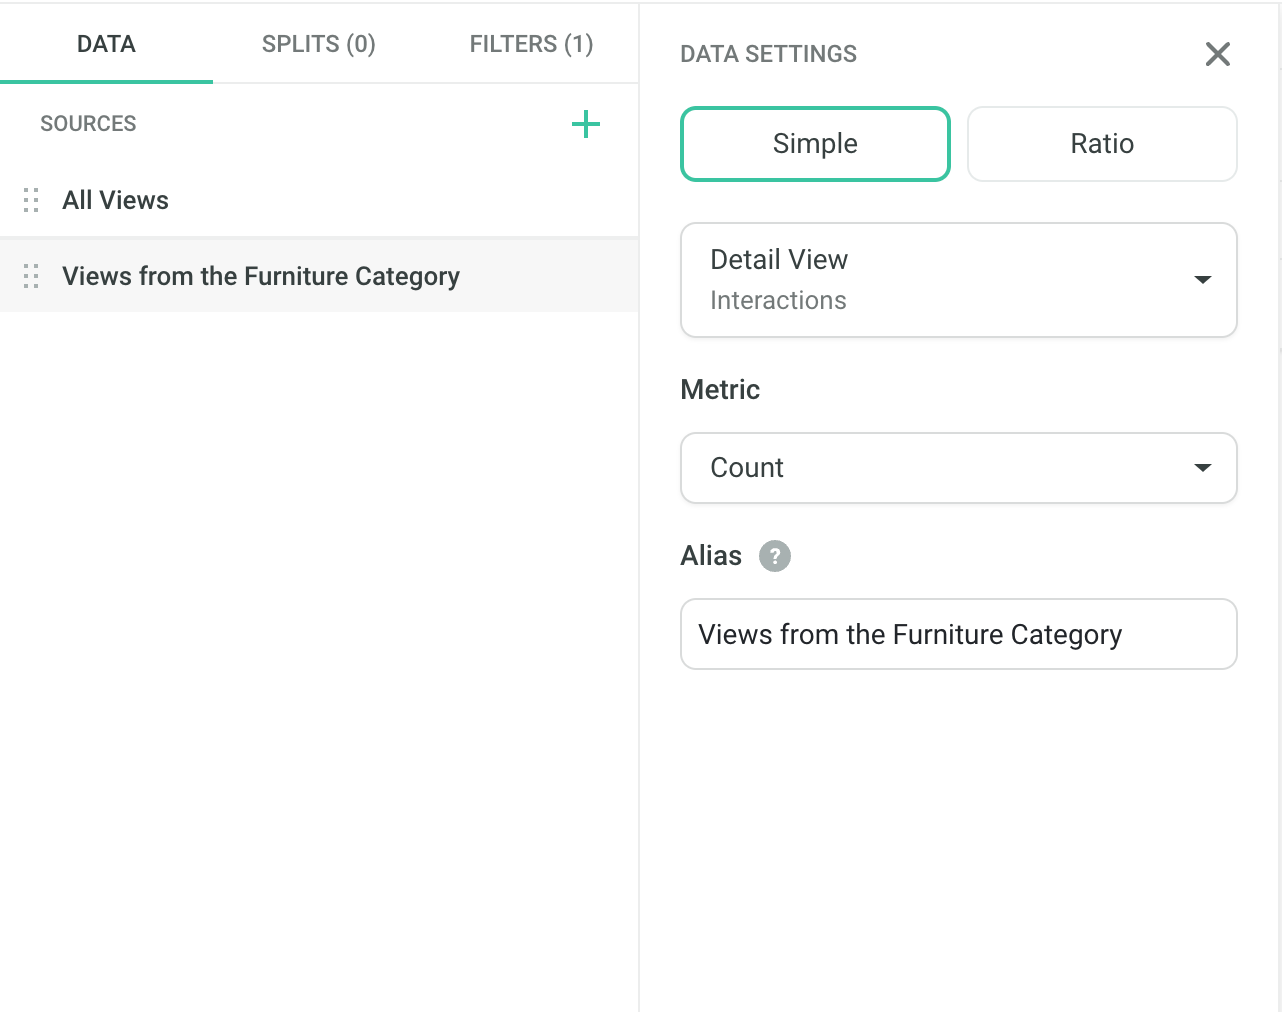
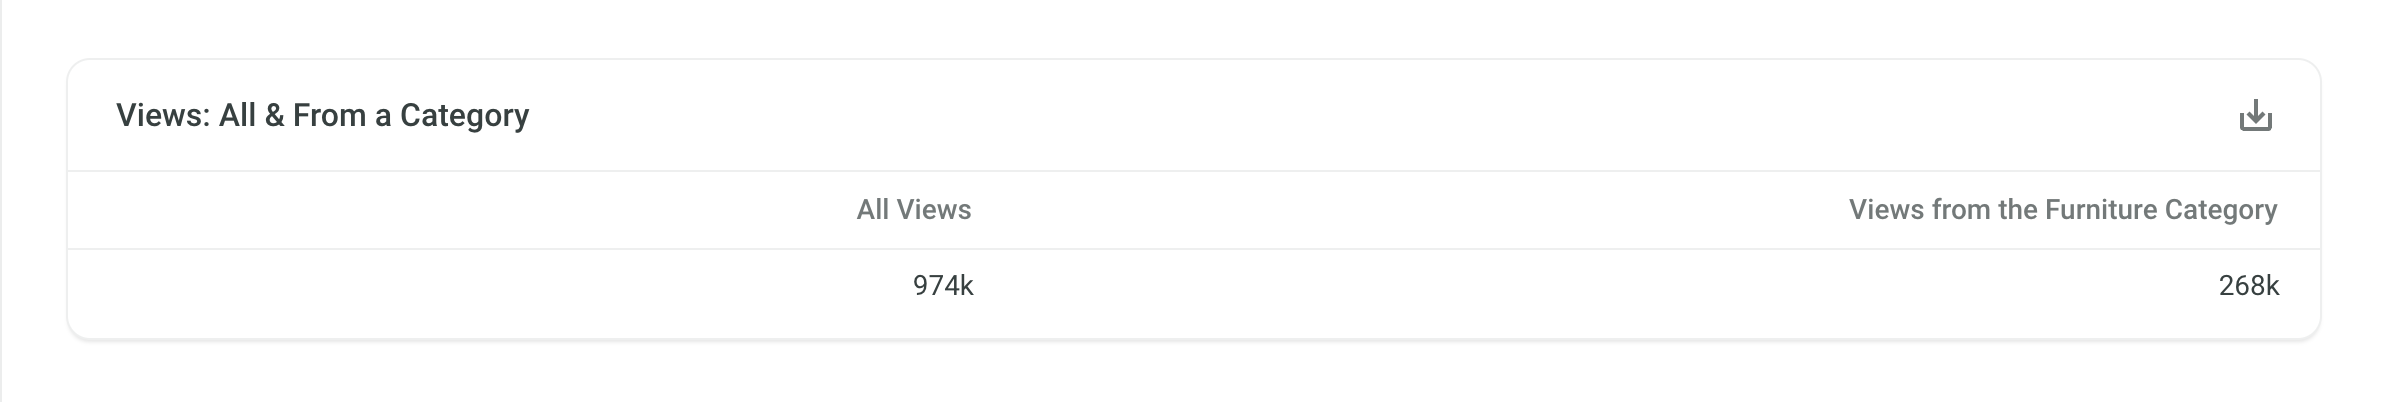
Example - Total number of Detail Views and number of Detail Views for Items from a category#
You can add the Count of Detail Views Data Source twice (with an Alias to distinguish them), and for one of them, set the Filter.
Data Sources
Filter
Which yields the following result
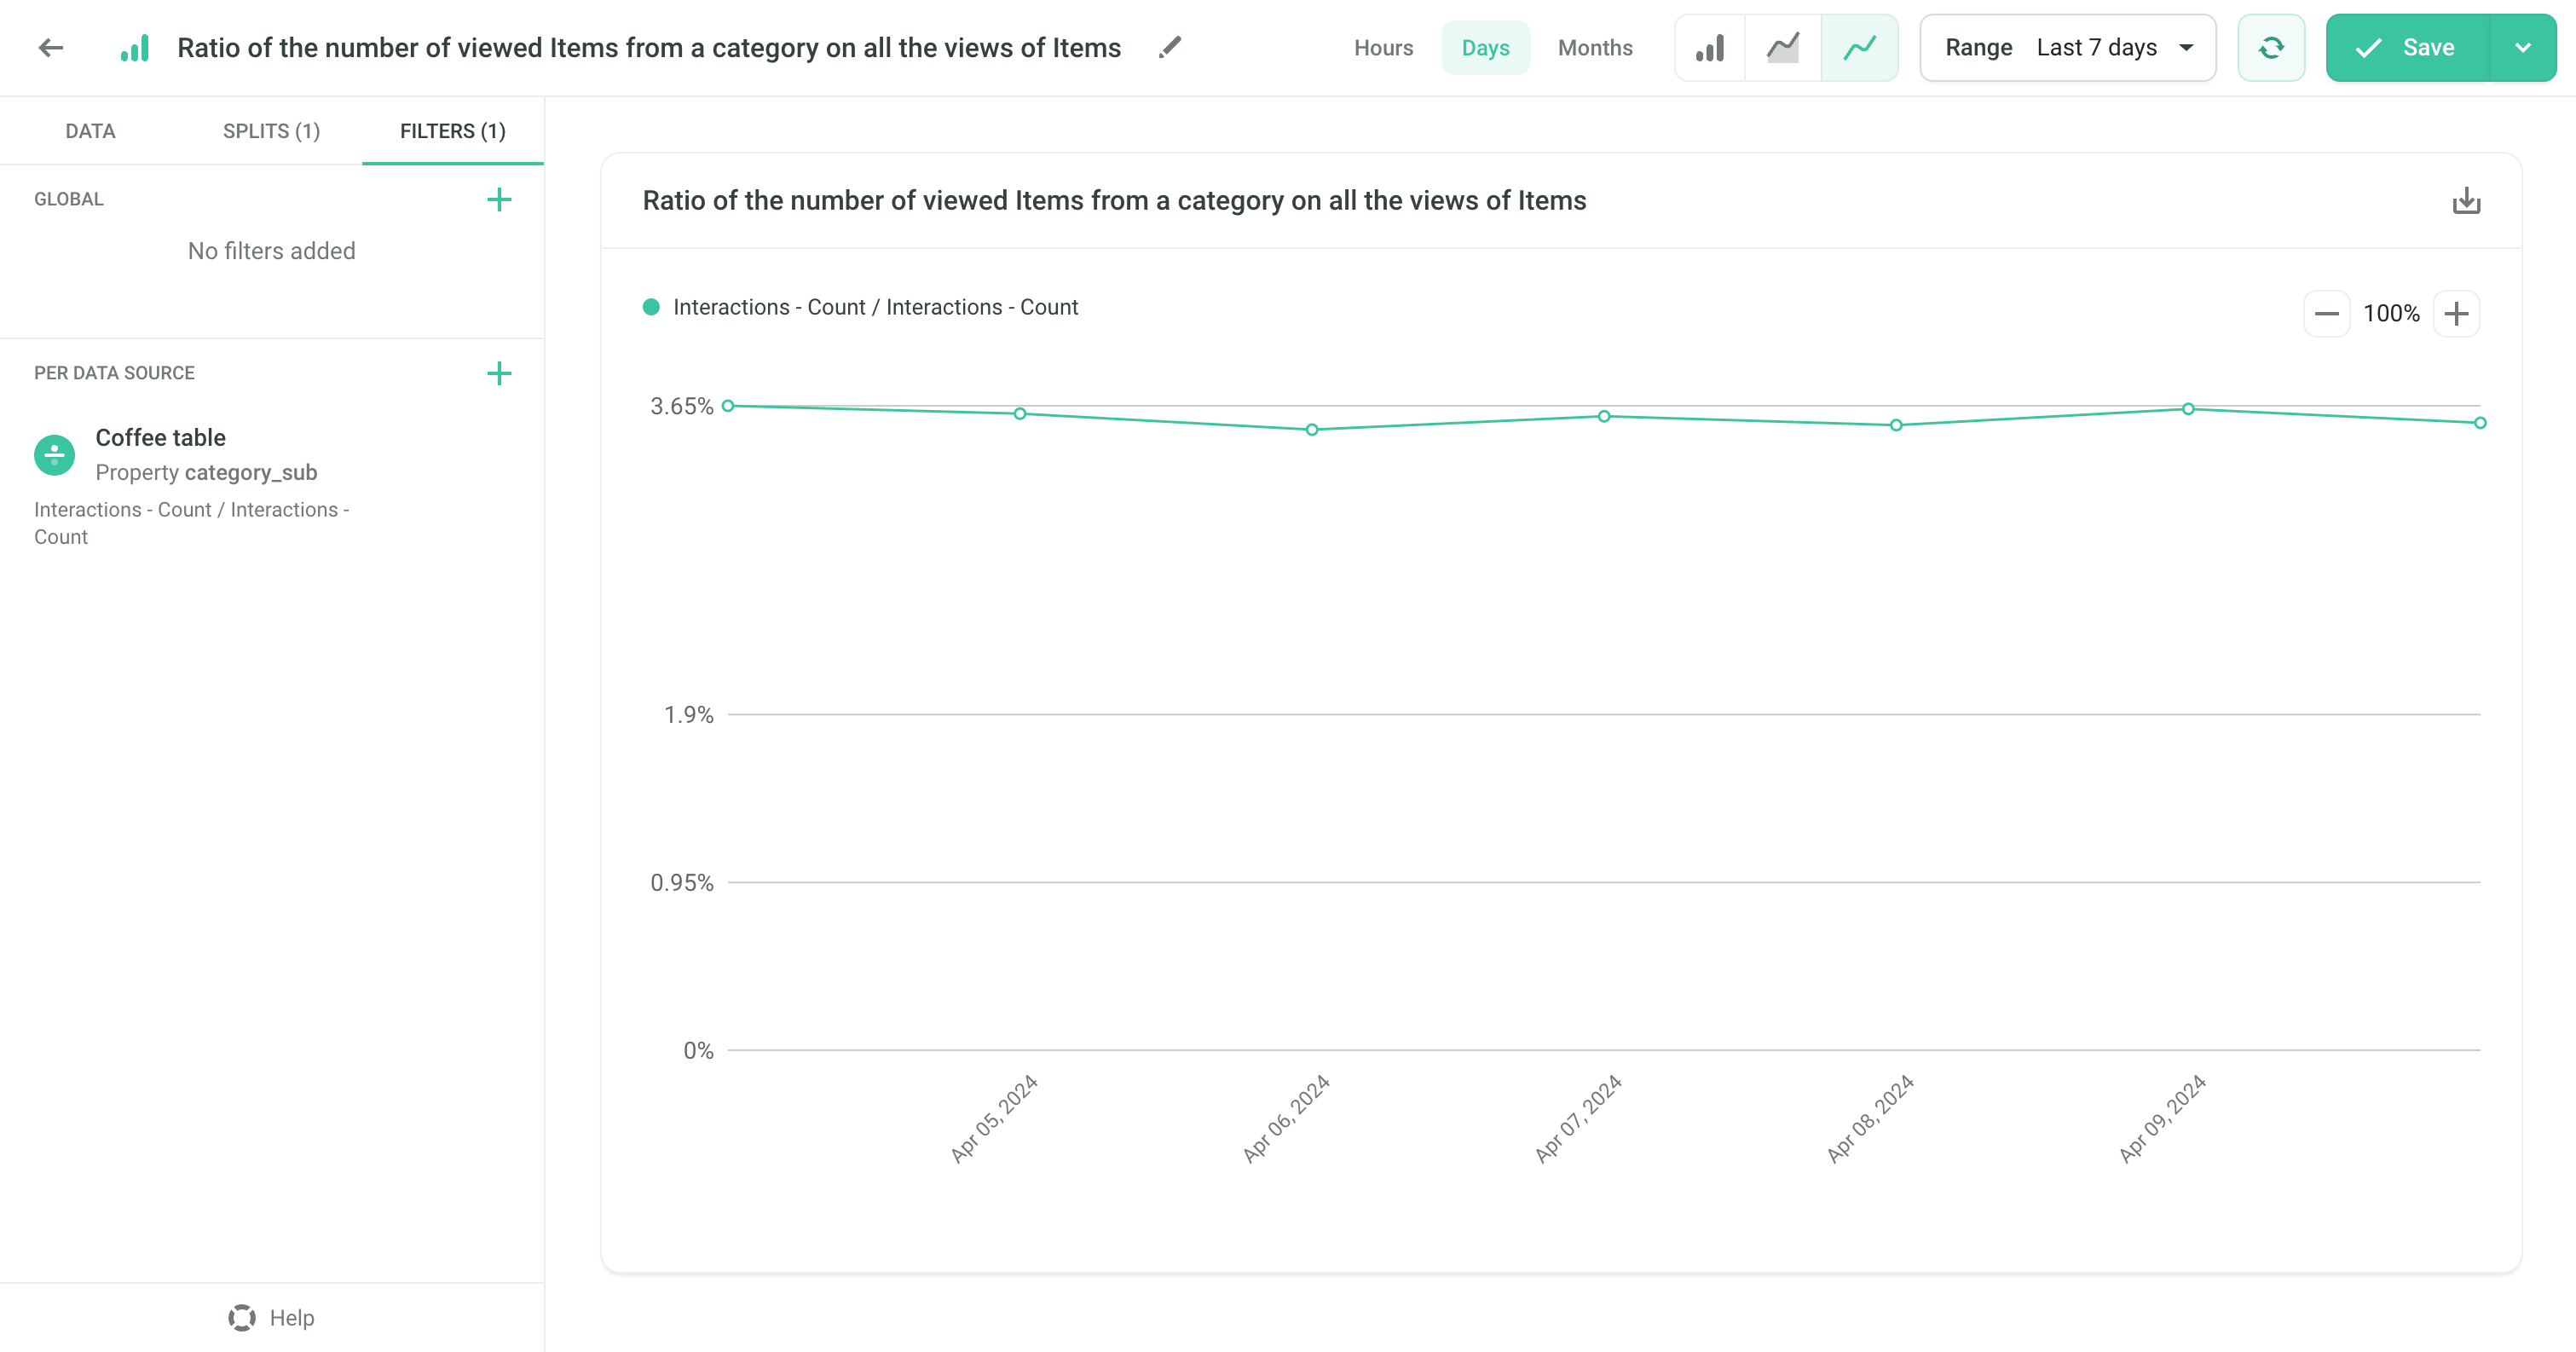
Example - The ratio of the number of viewed Items from a category on all the views of Items#
This Insight is set as a Ratio Data Source, where both the numerator and denominator are set to the Count of Detail Views, and the Filter on a category is applied to the numerator.
Data Source
Filter
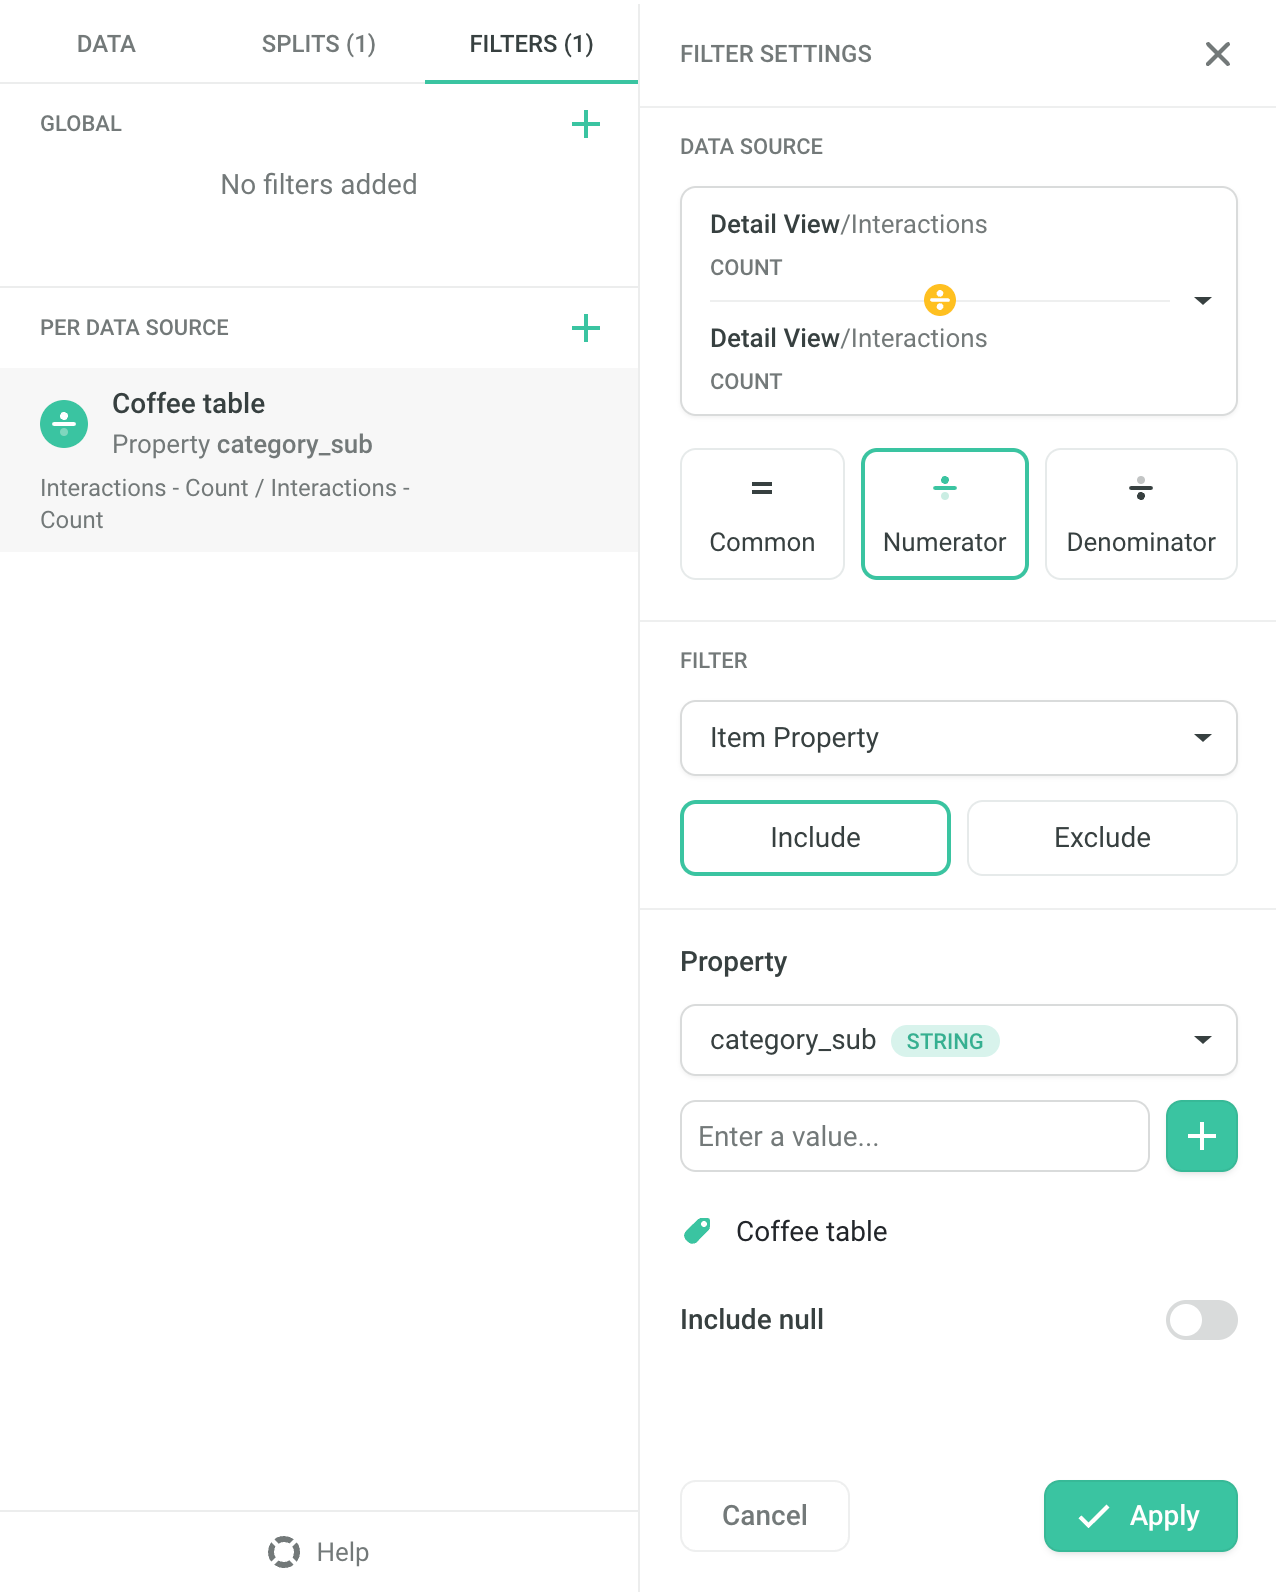
The result is the portion of the views of Items from the particular property on all the views
Splits#
A Split breaks down the data by a field. The field must be available in all the added Data Sources.
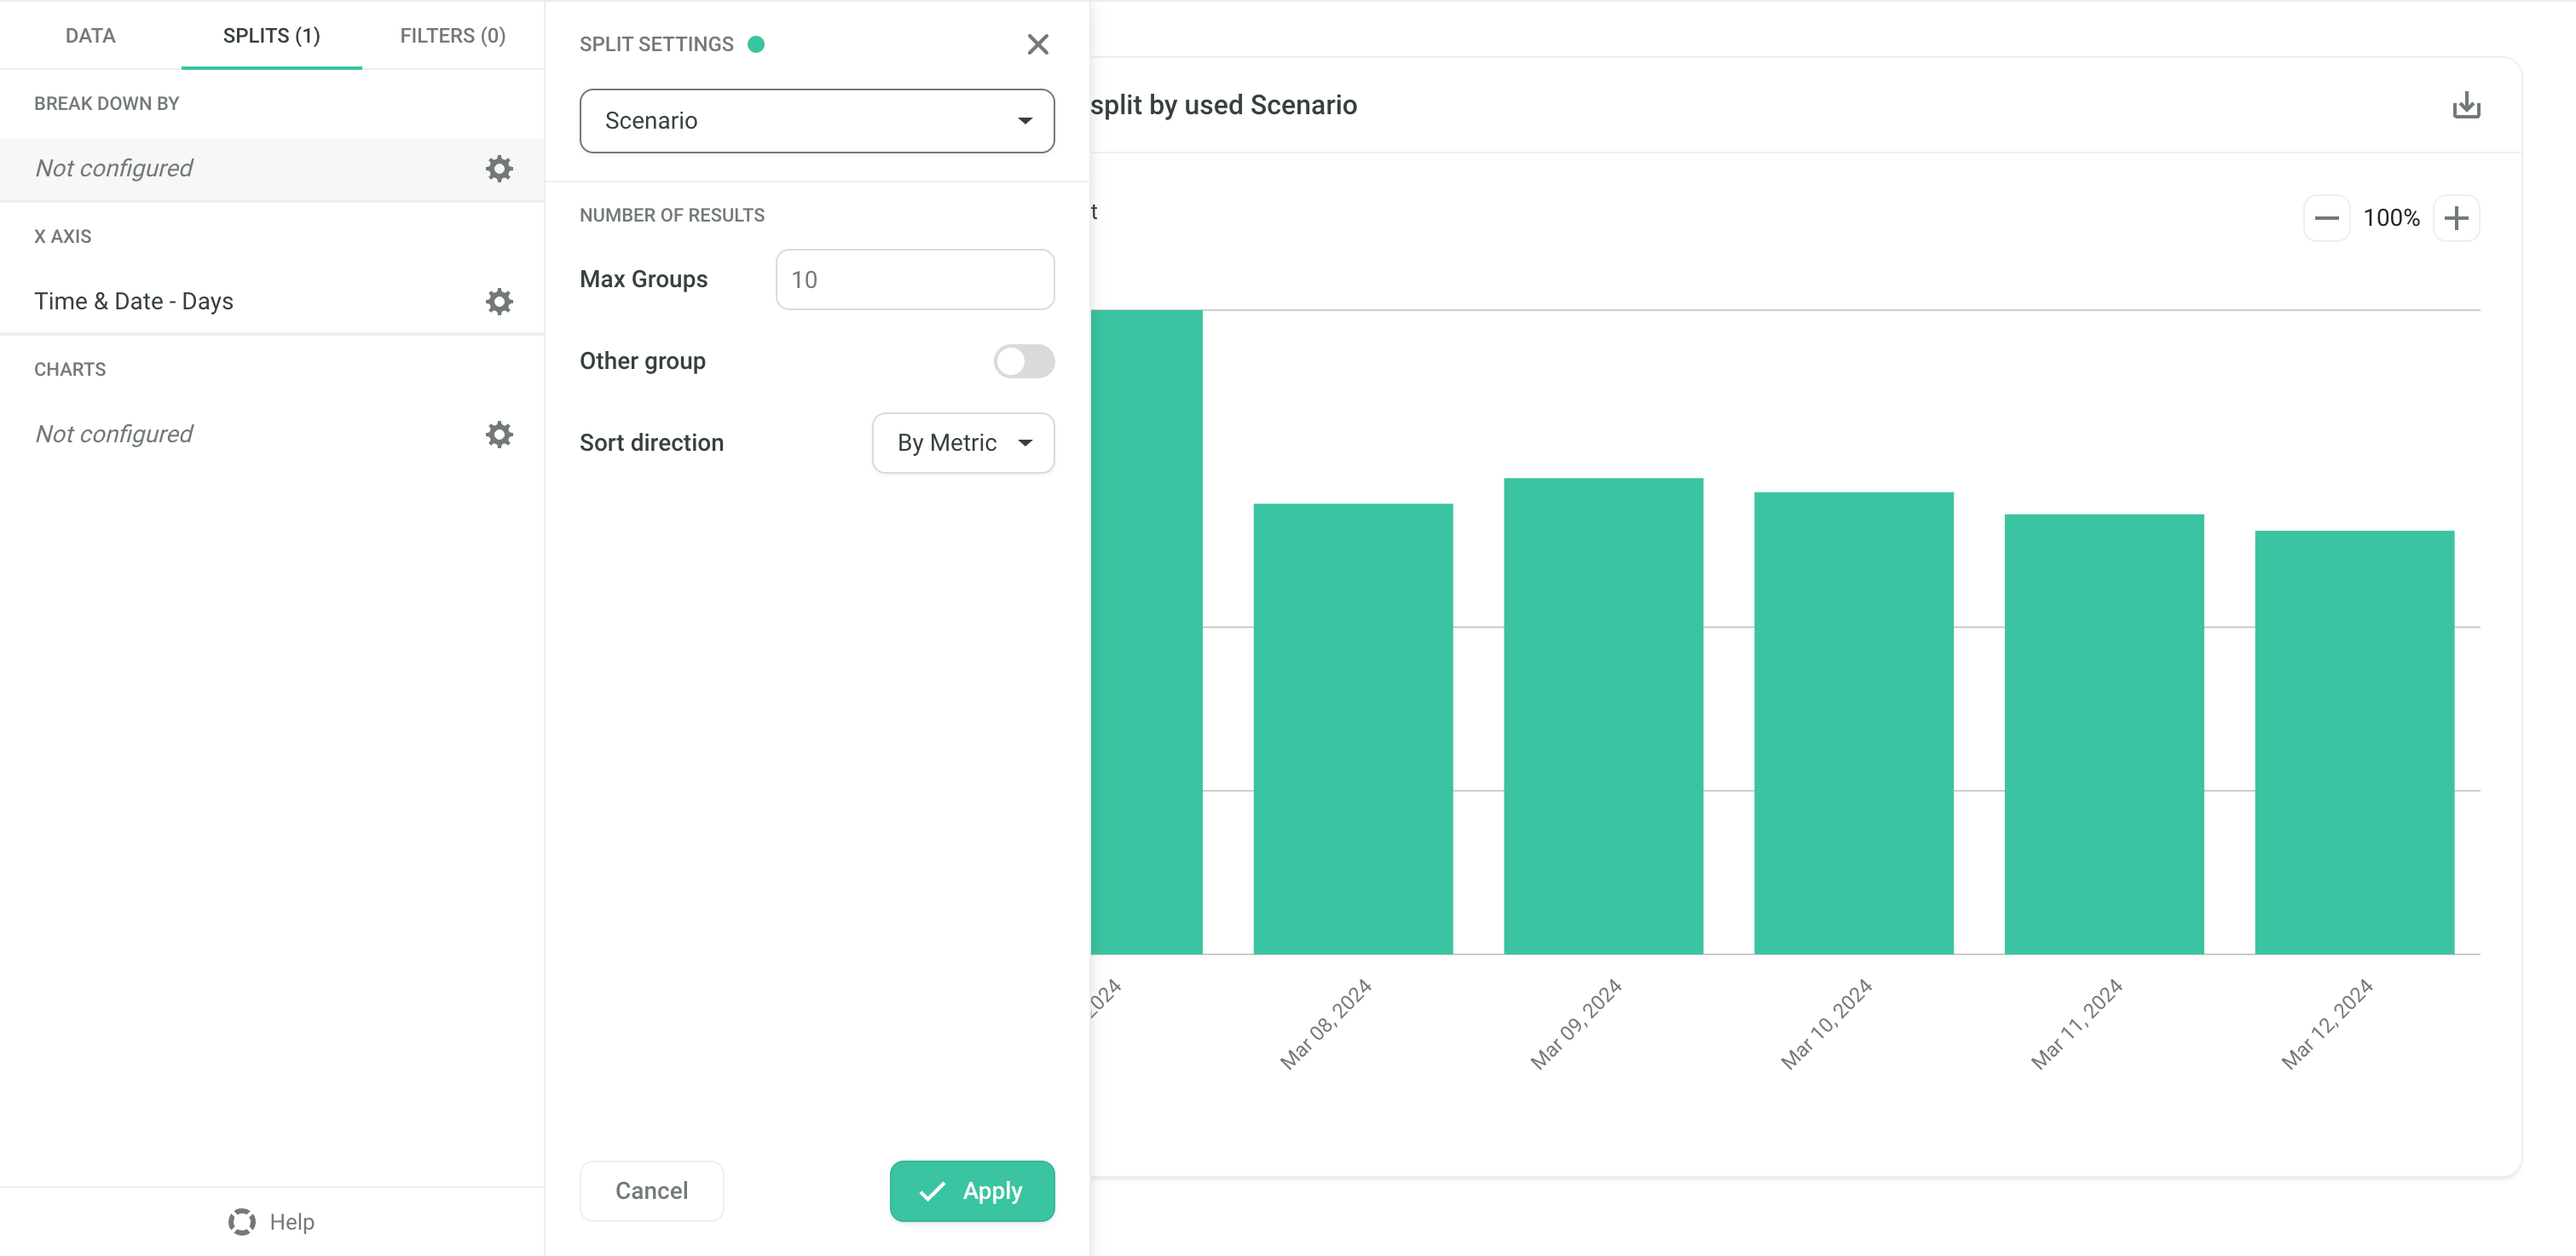
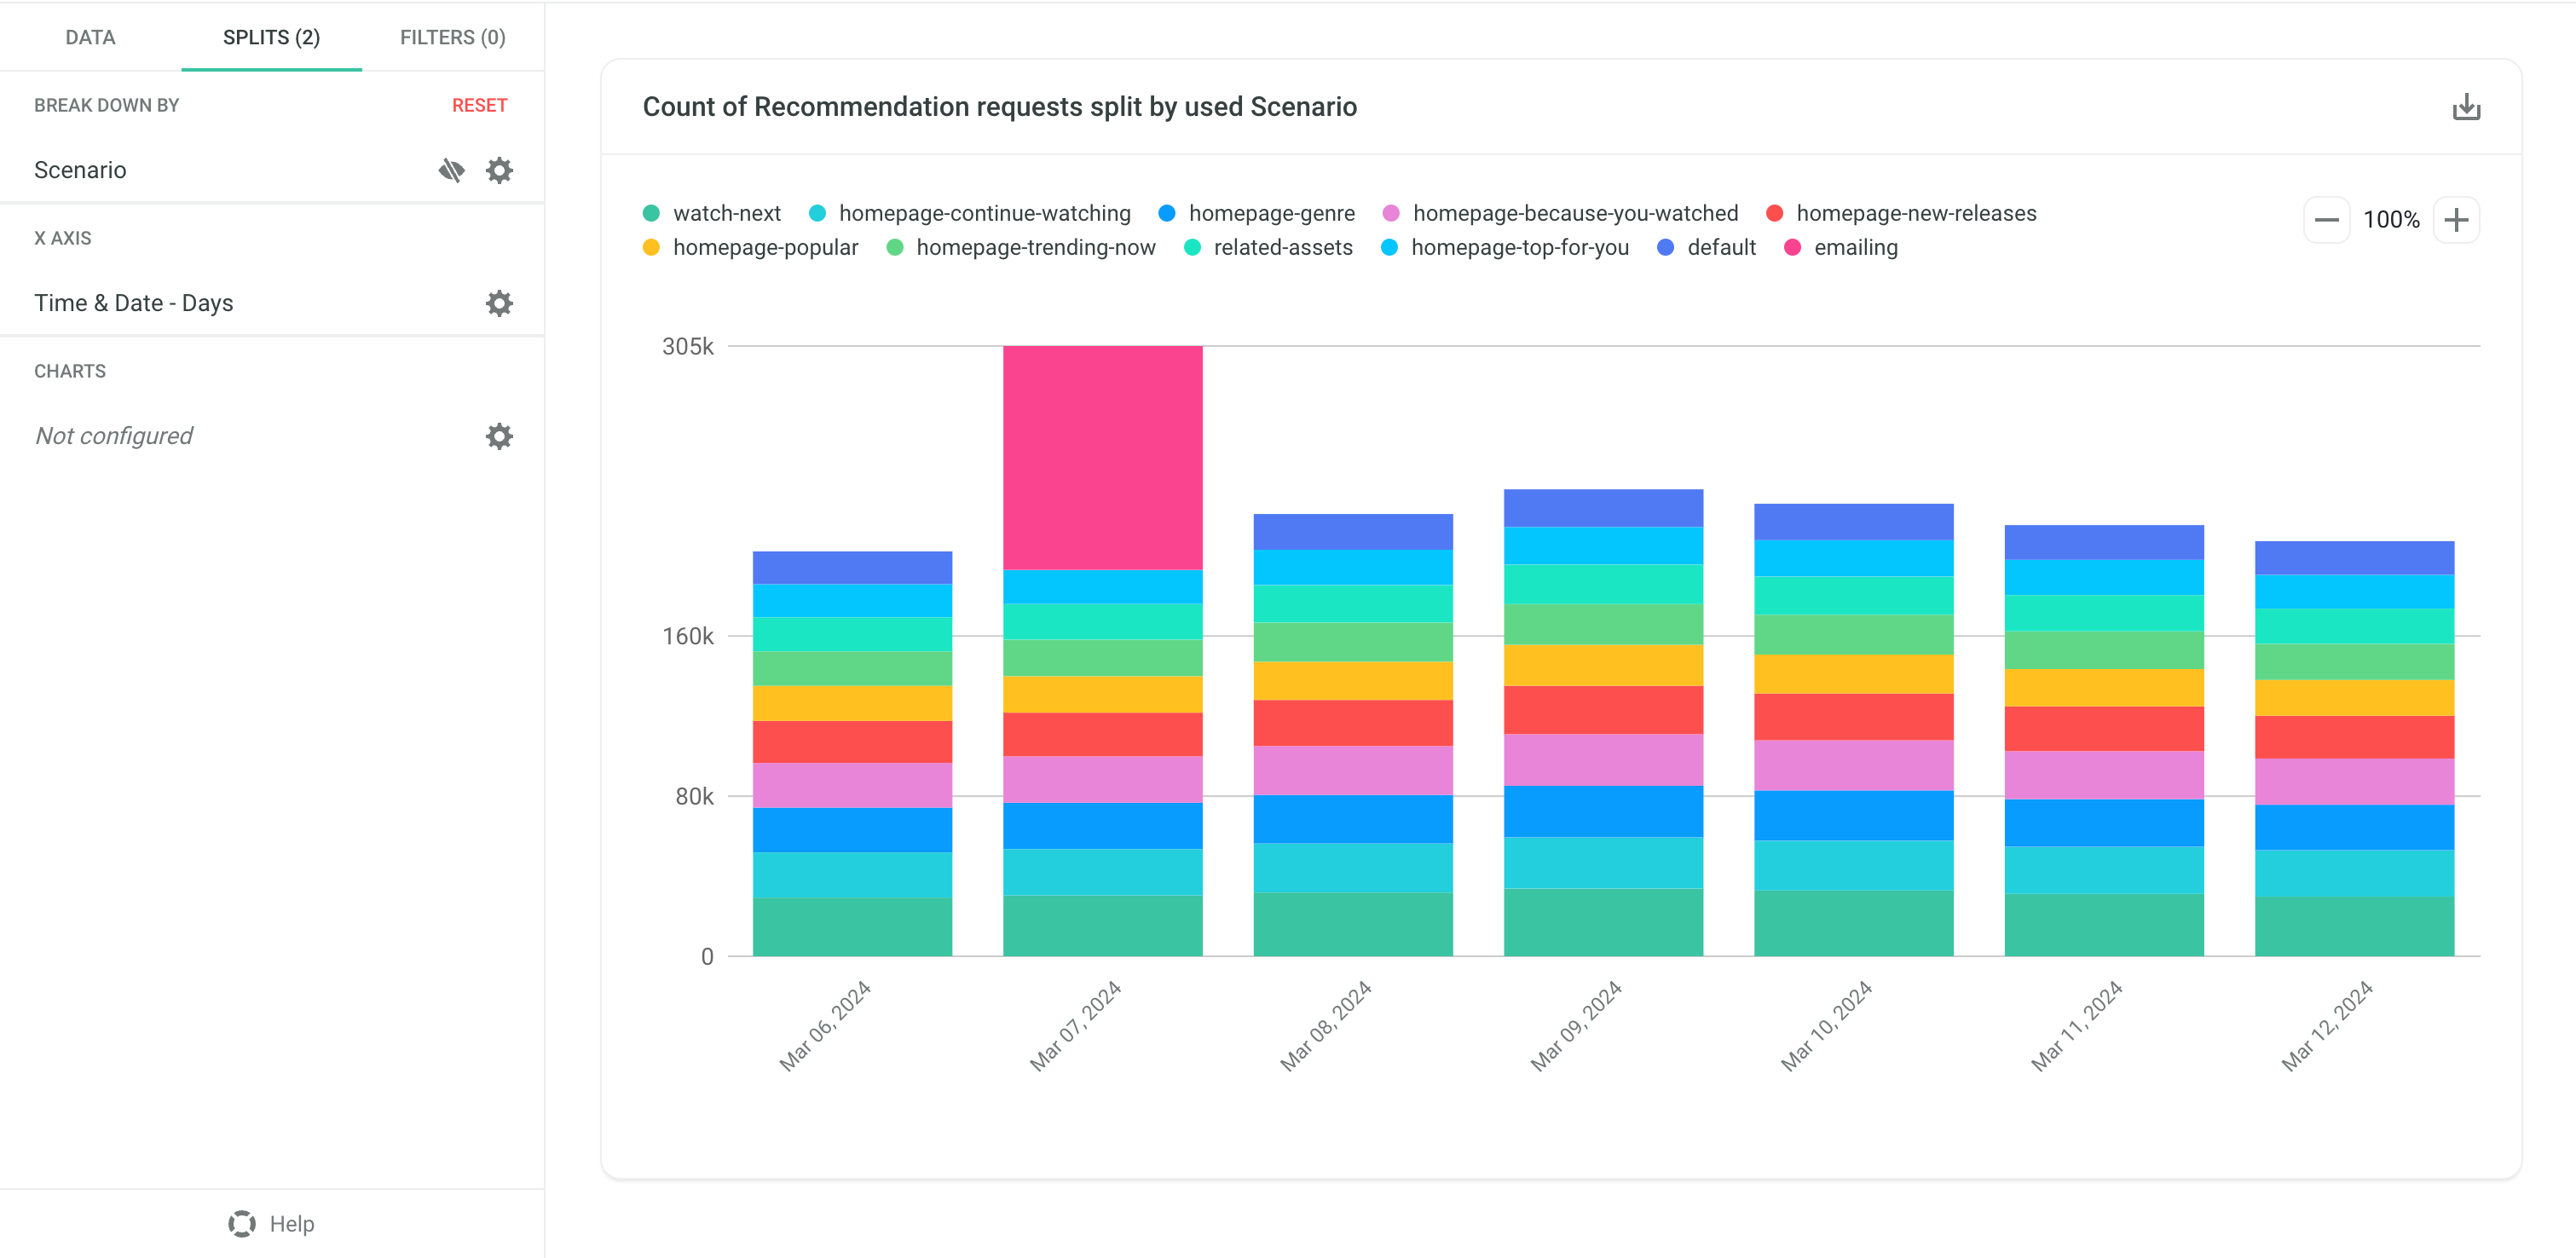
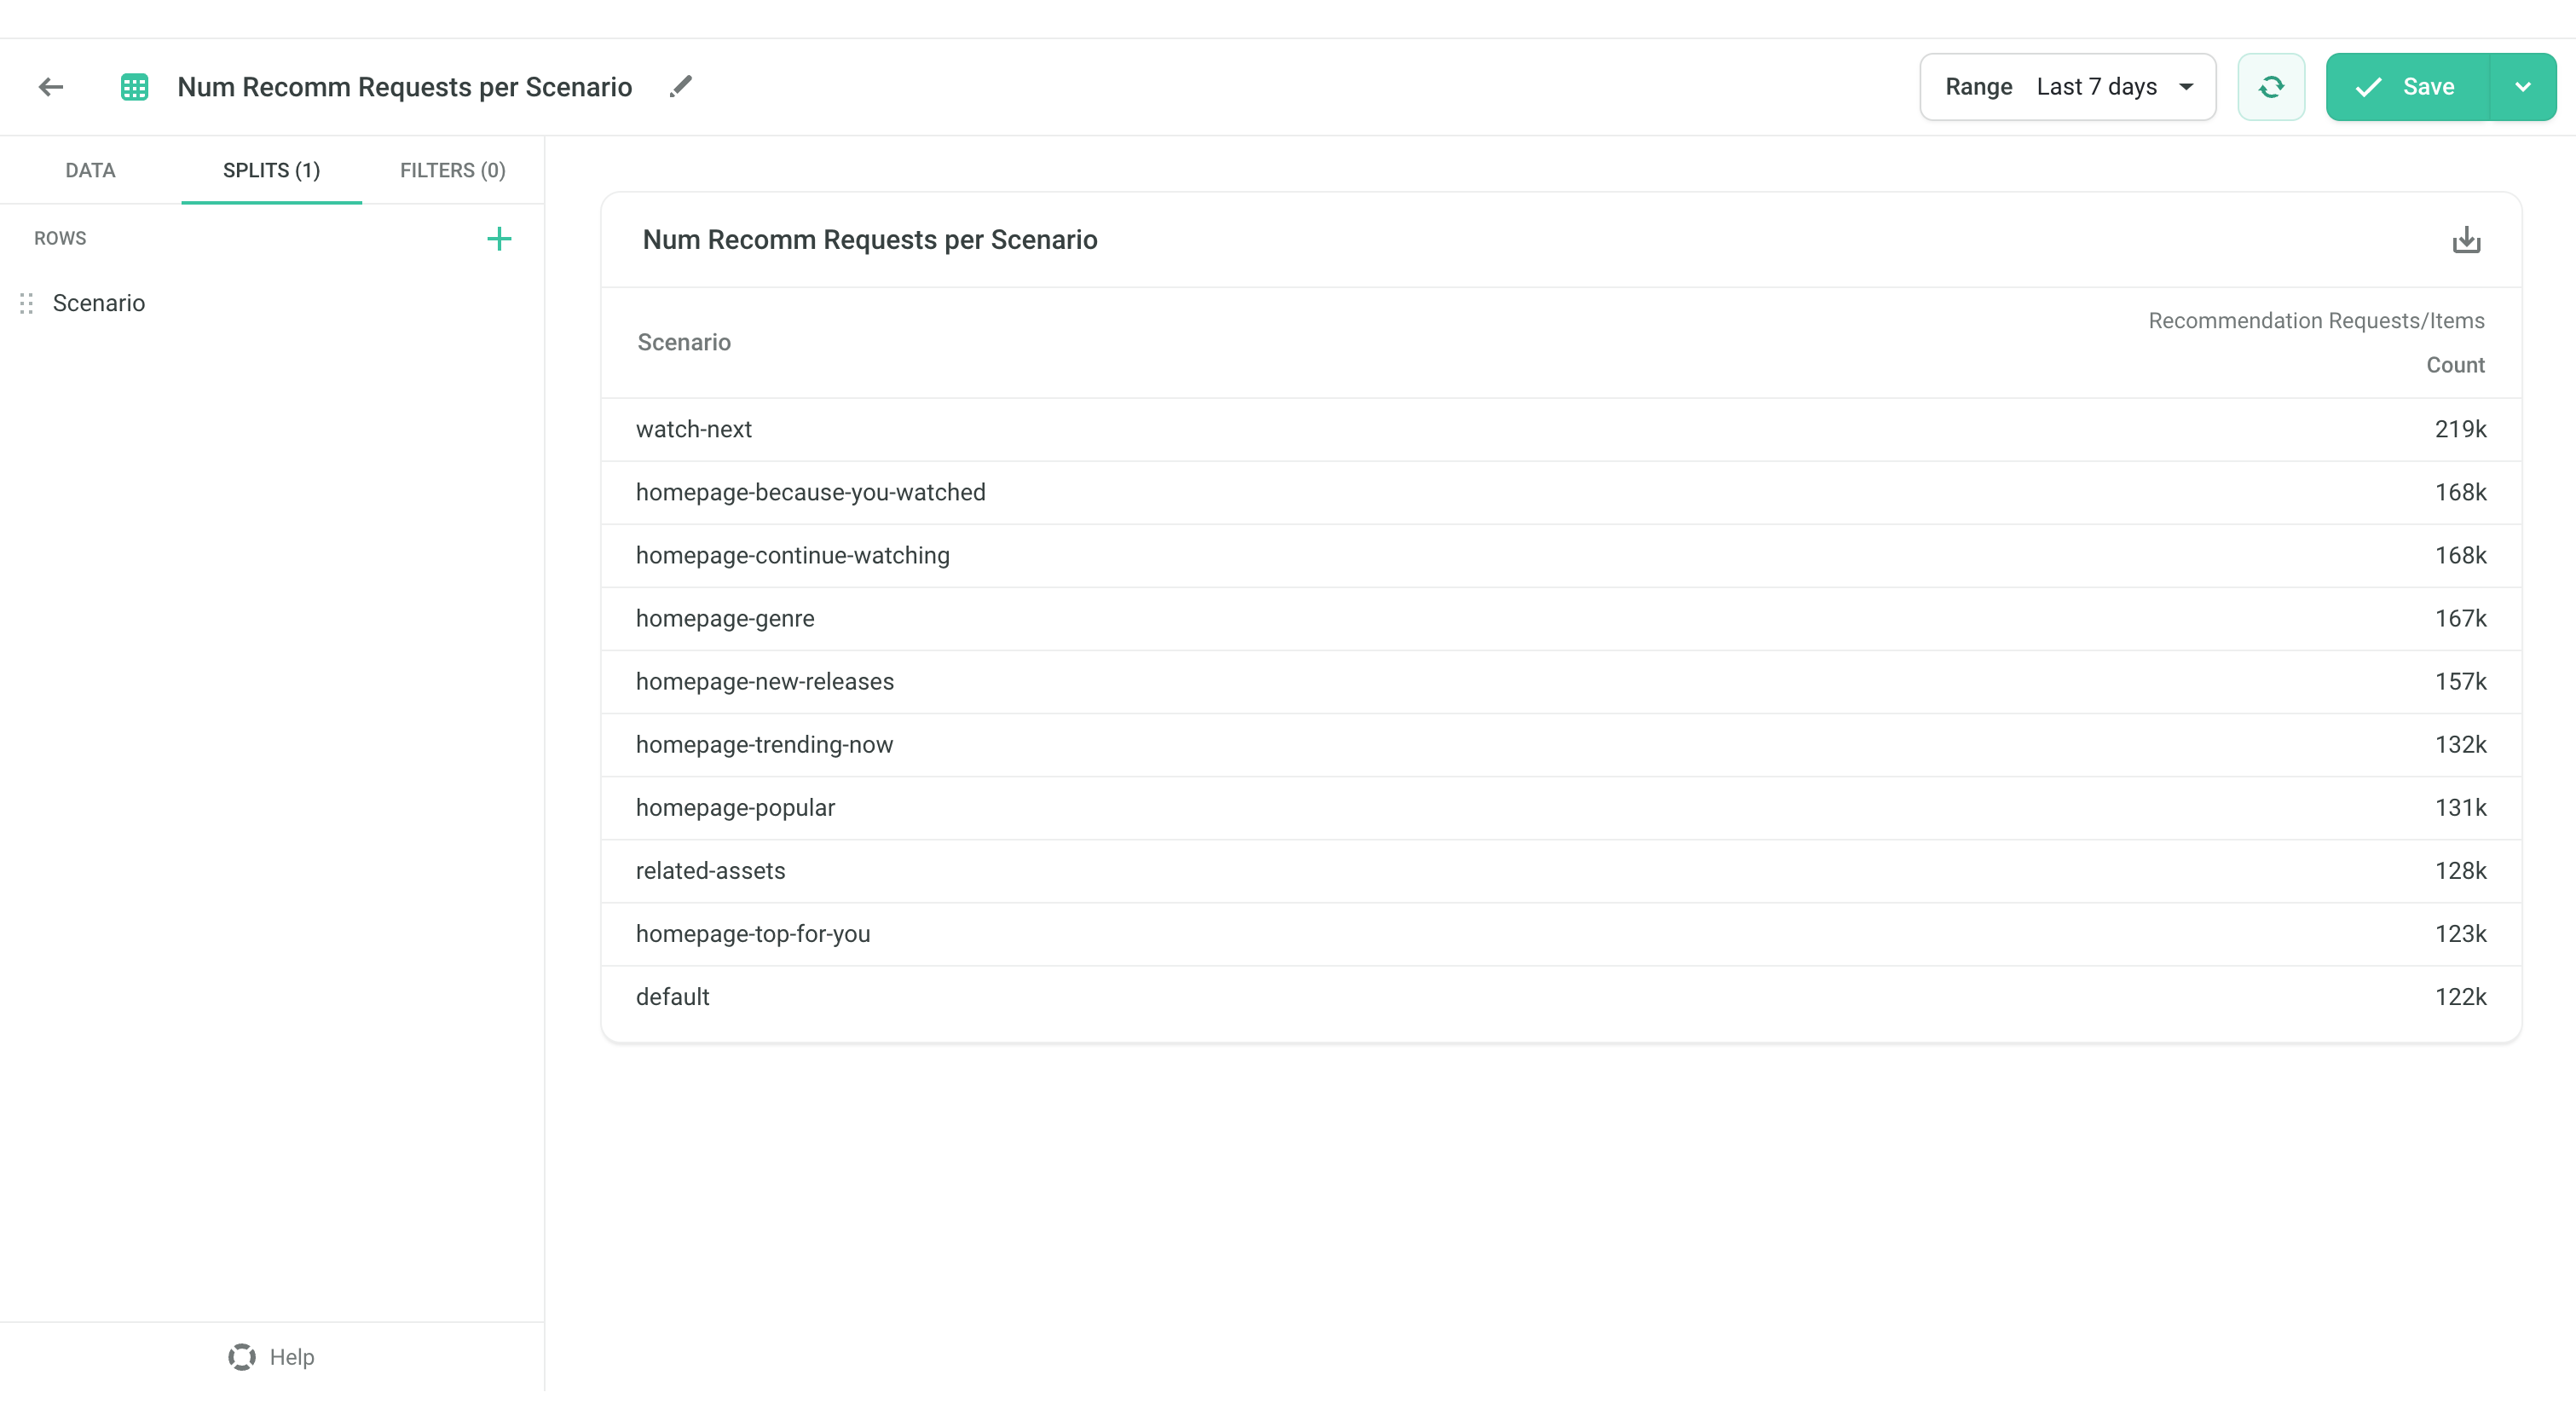
Example - Count of Recommendation requests split by used Scenario#
Adding Split on Scenario shows the number of requests per Scenario.
↓
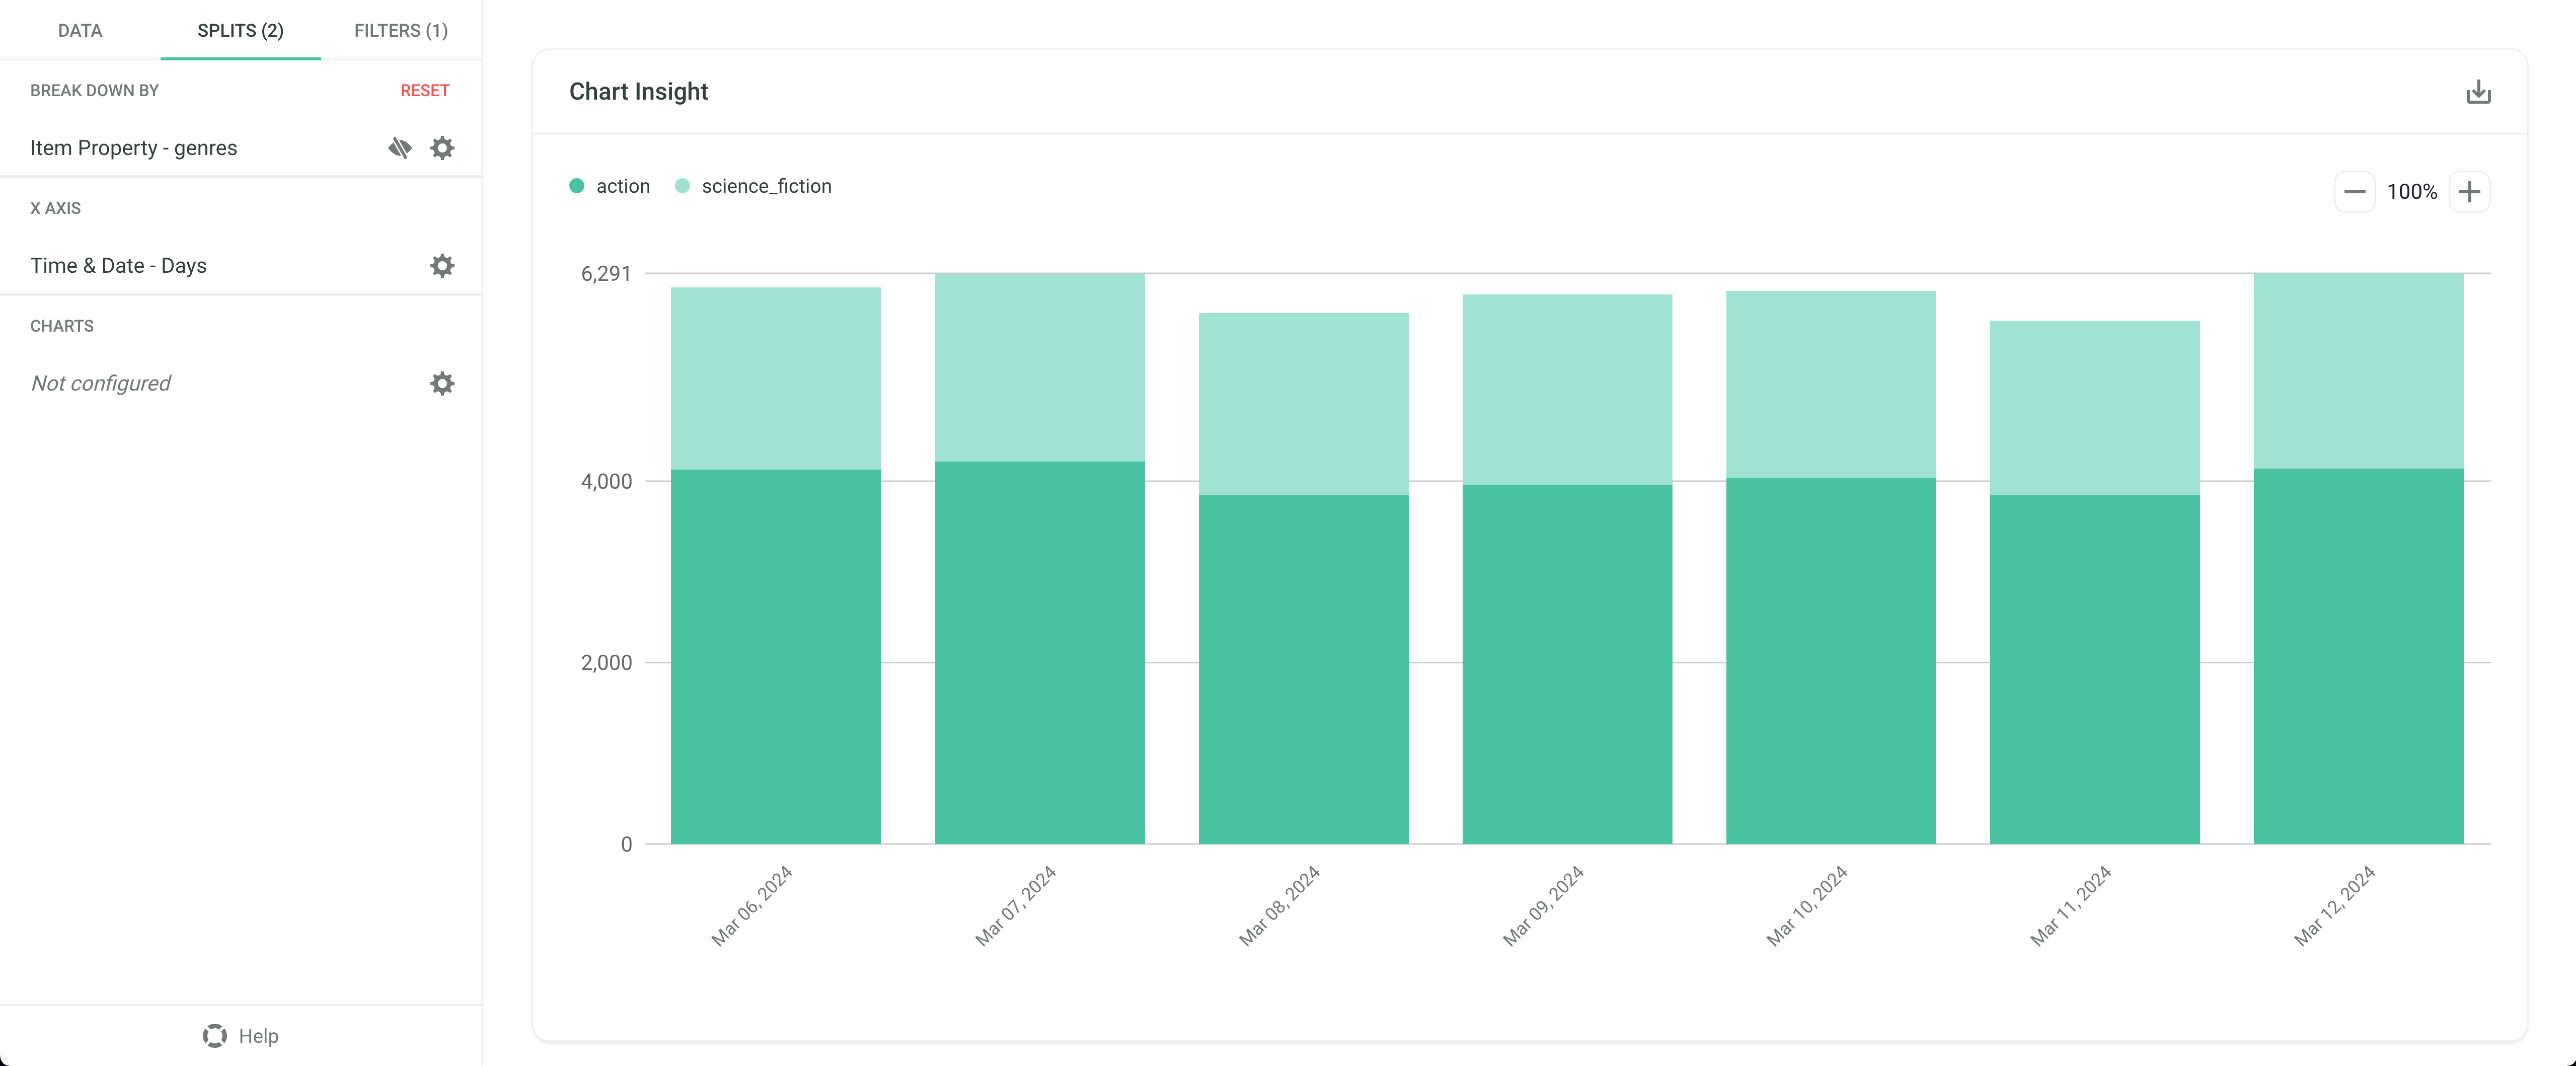
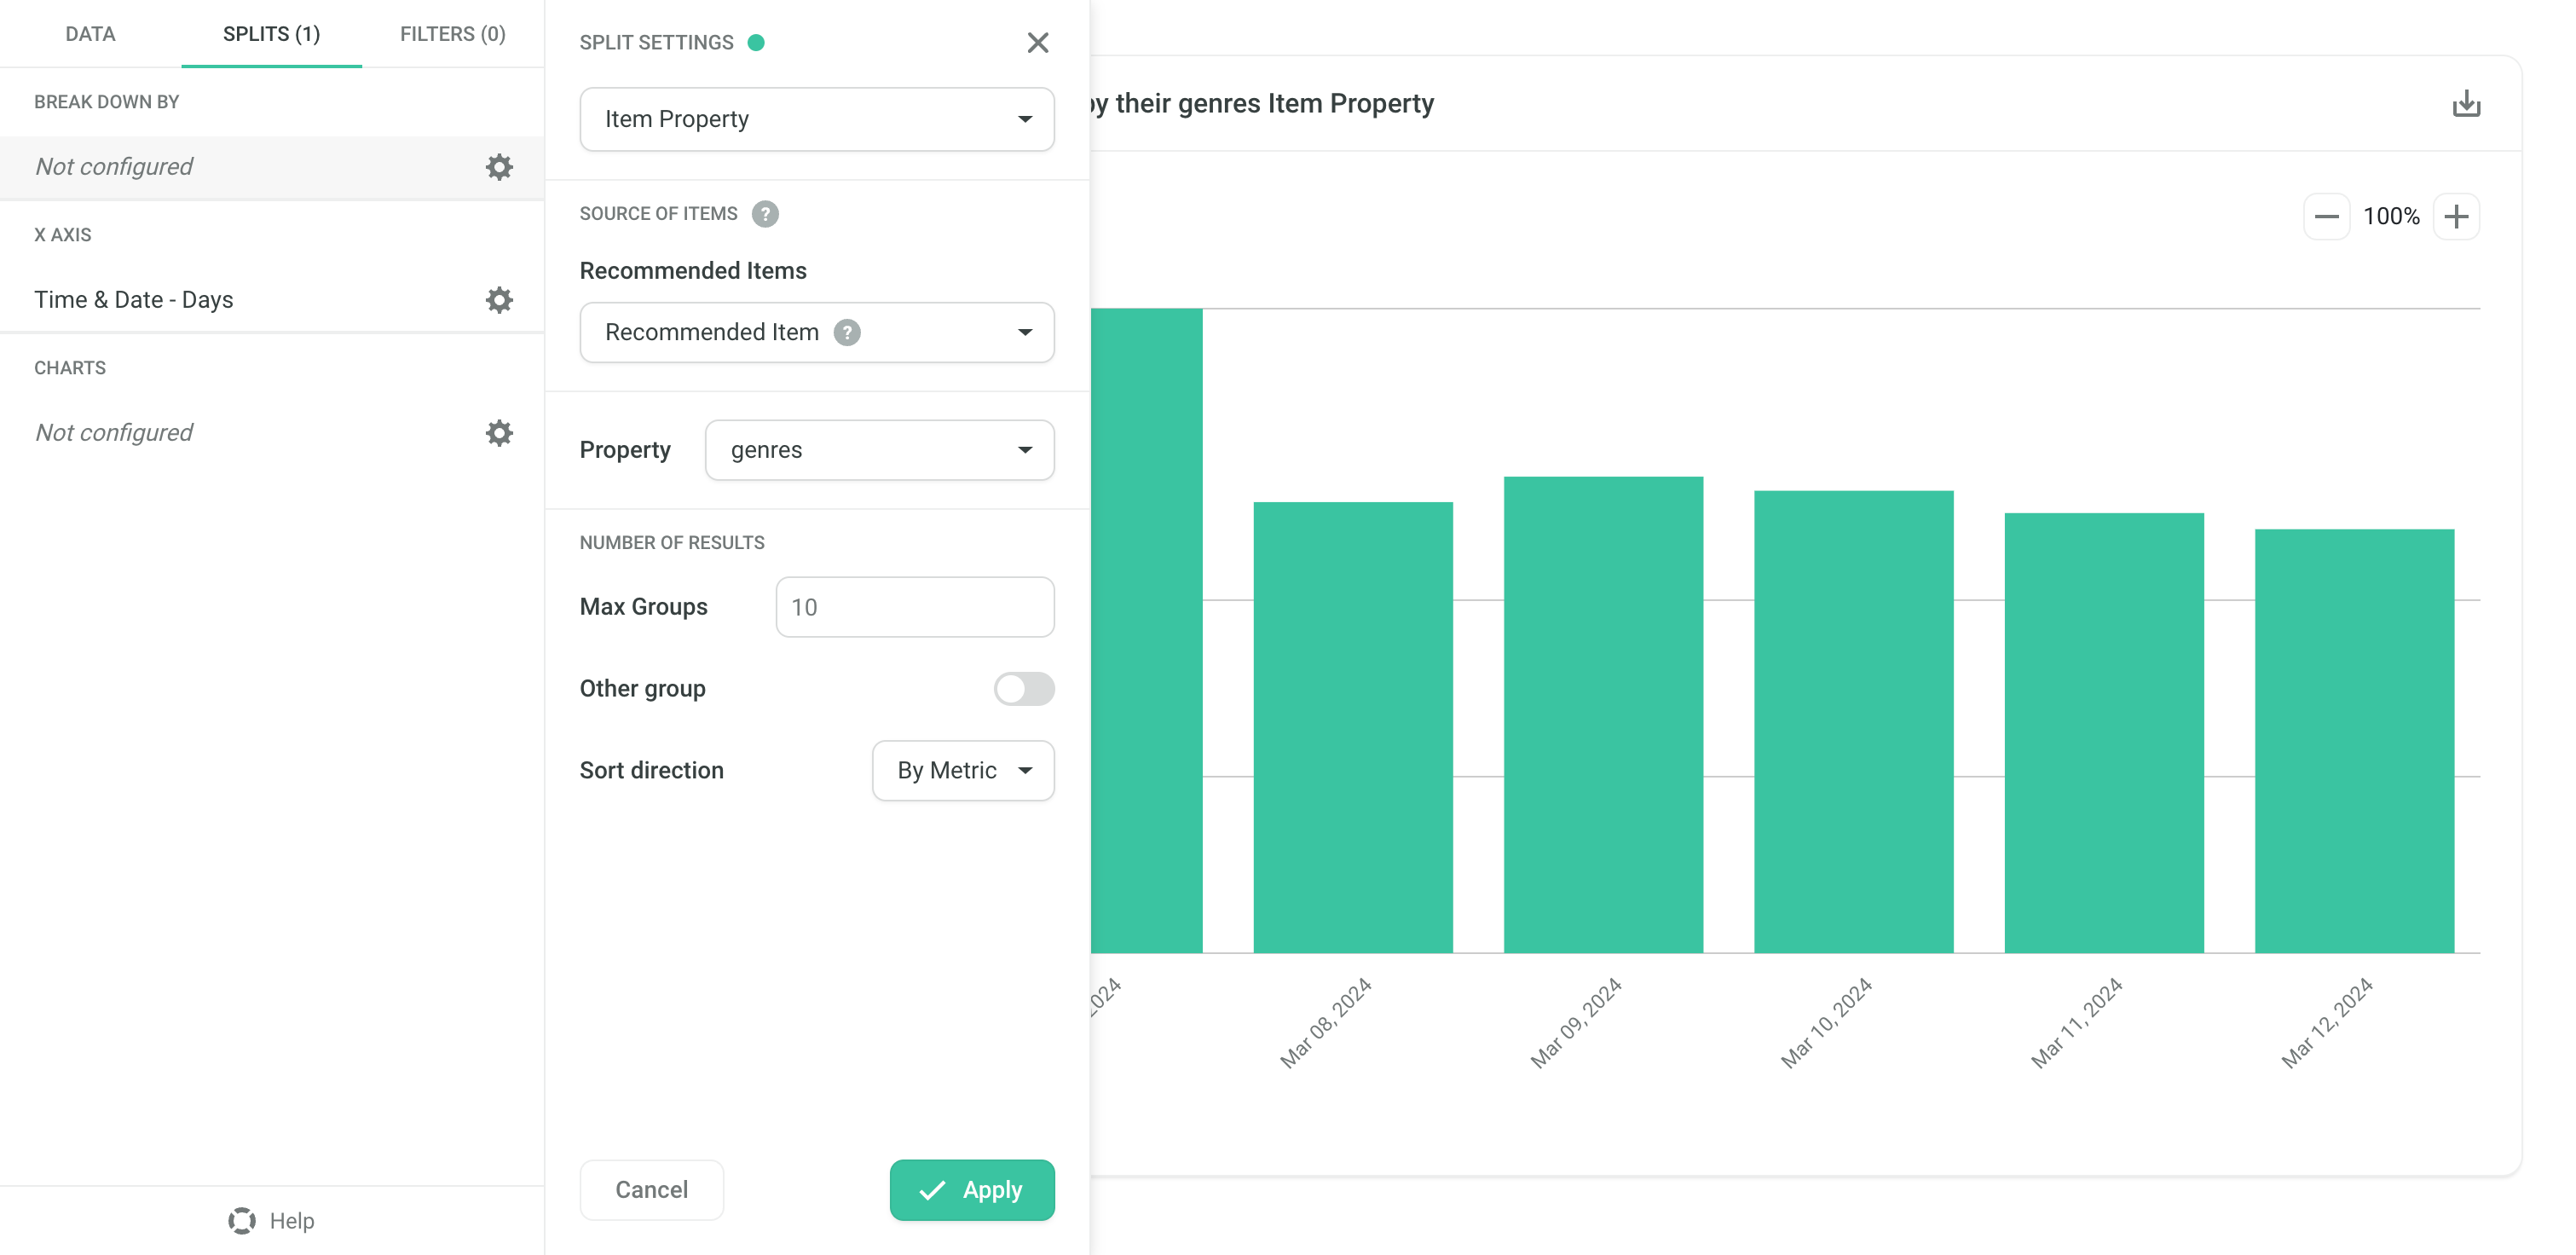
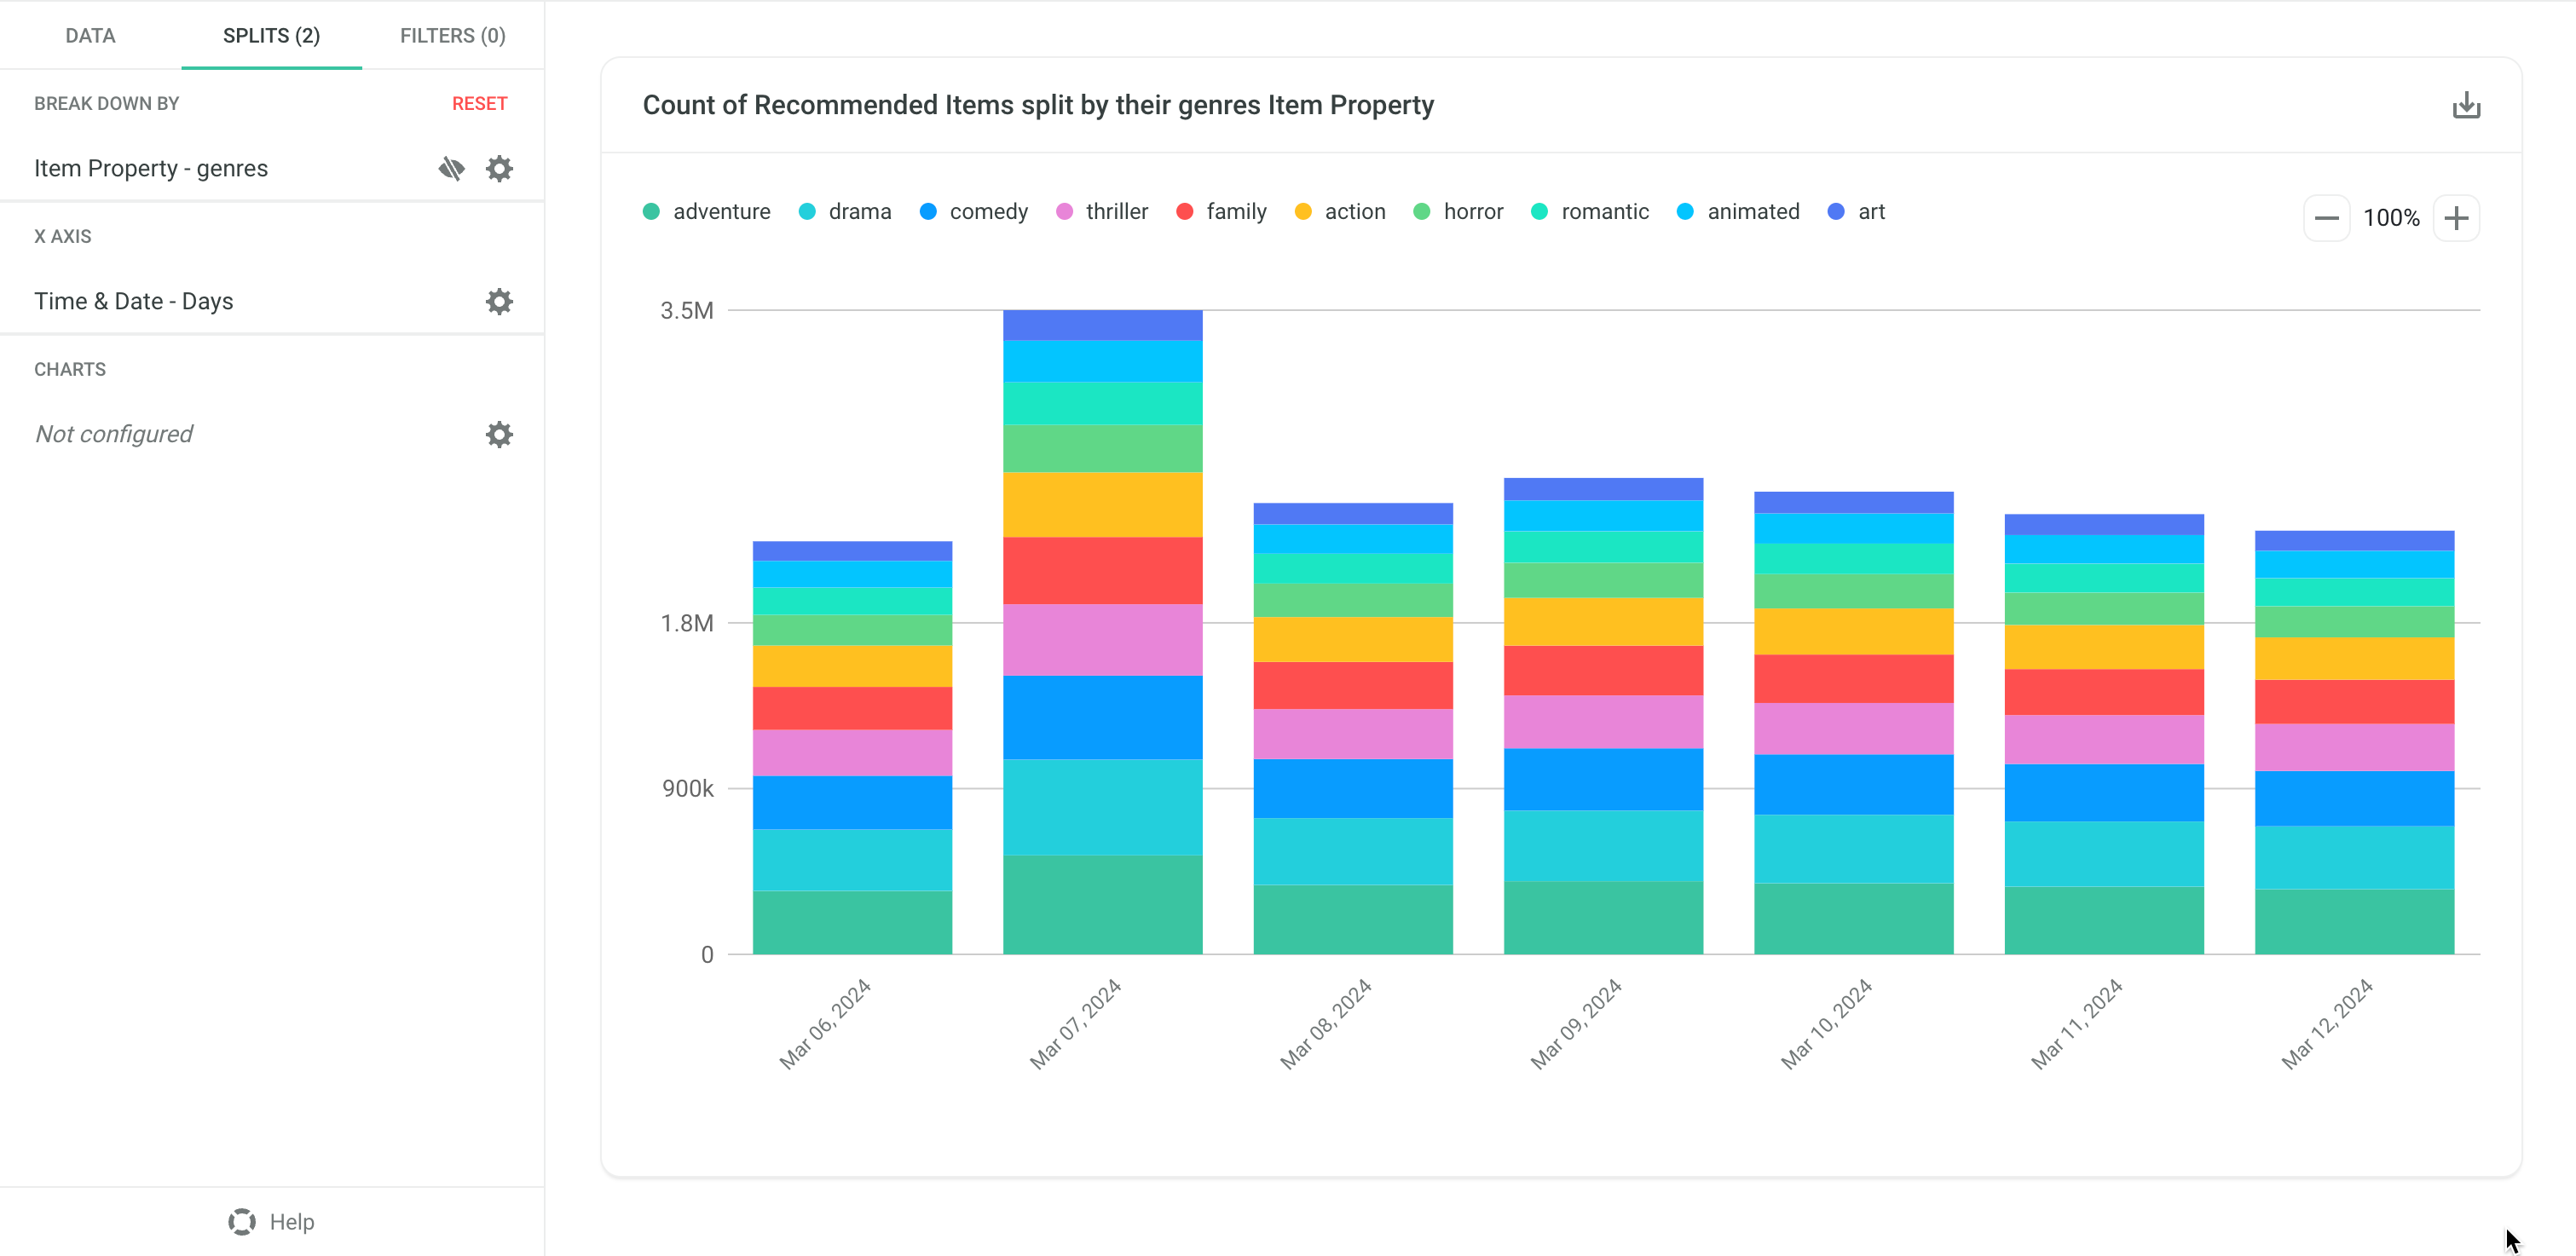
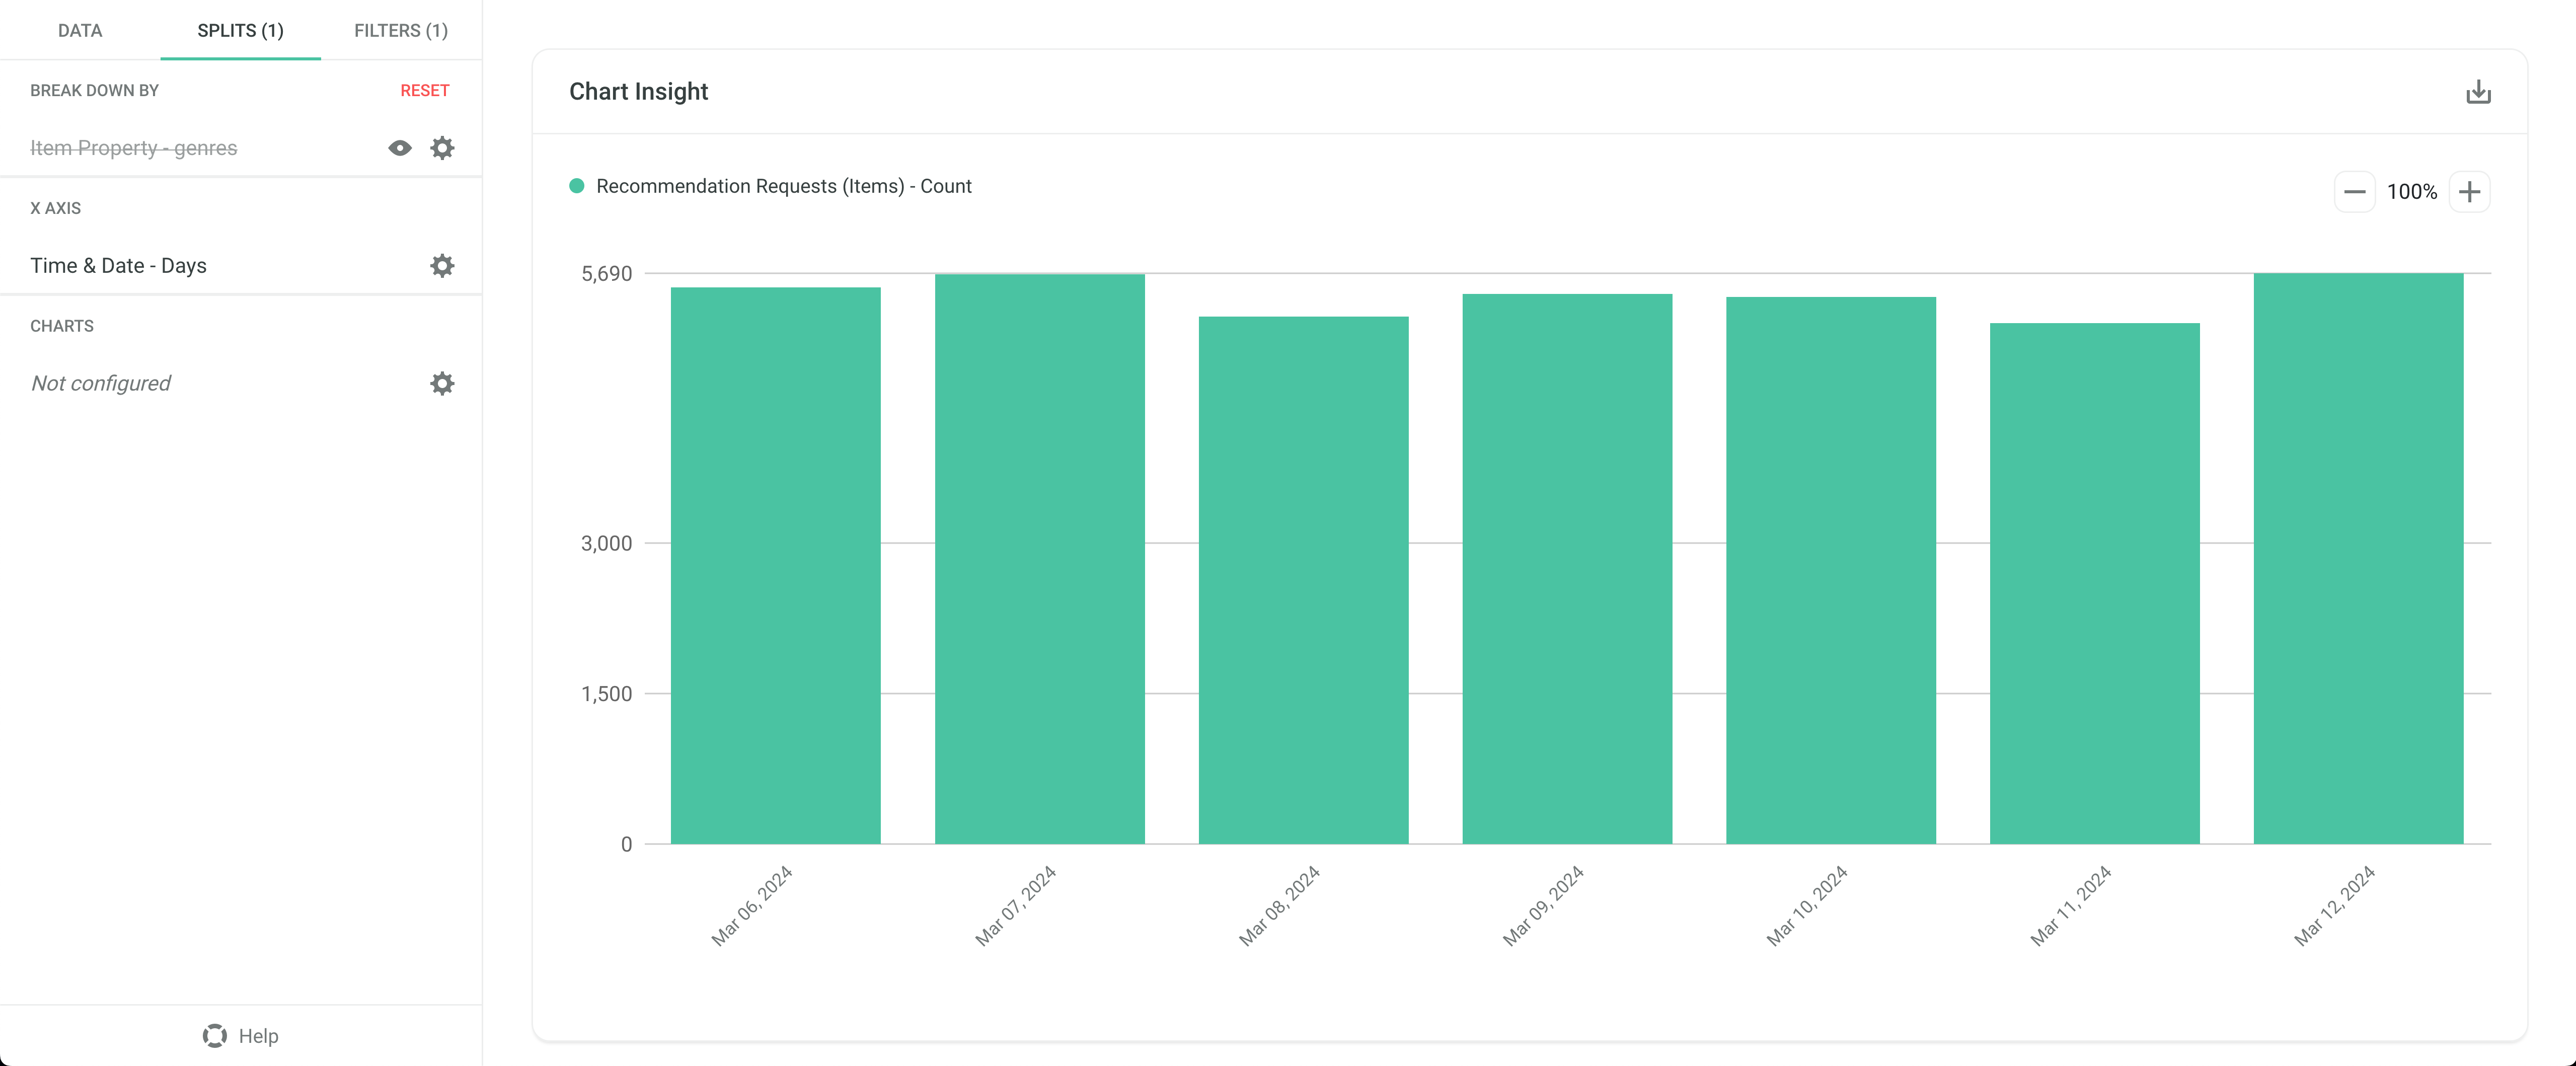
Example - Count of Recommended Items split by their genres Item Property#
Adding the Split on Item Property called genres shows the number of recommended items (in this case movies) per their genre.
↓
Example - Sum of Price of Purchases Based on Recommendations split by Scenario and User ID#
This Insight requires two Splits:
- The first one on Scenario
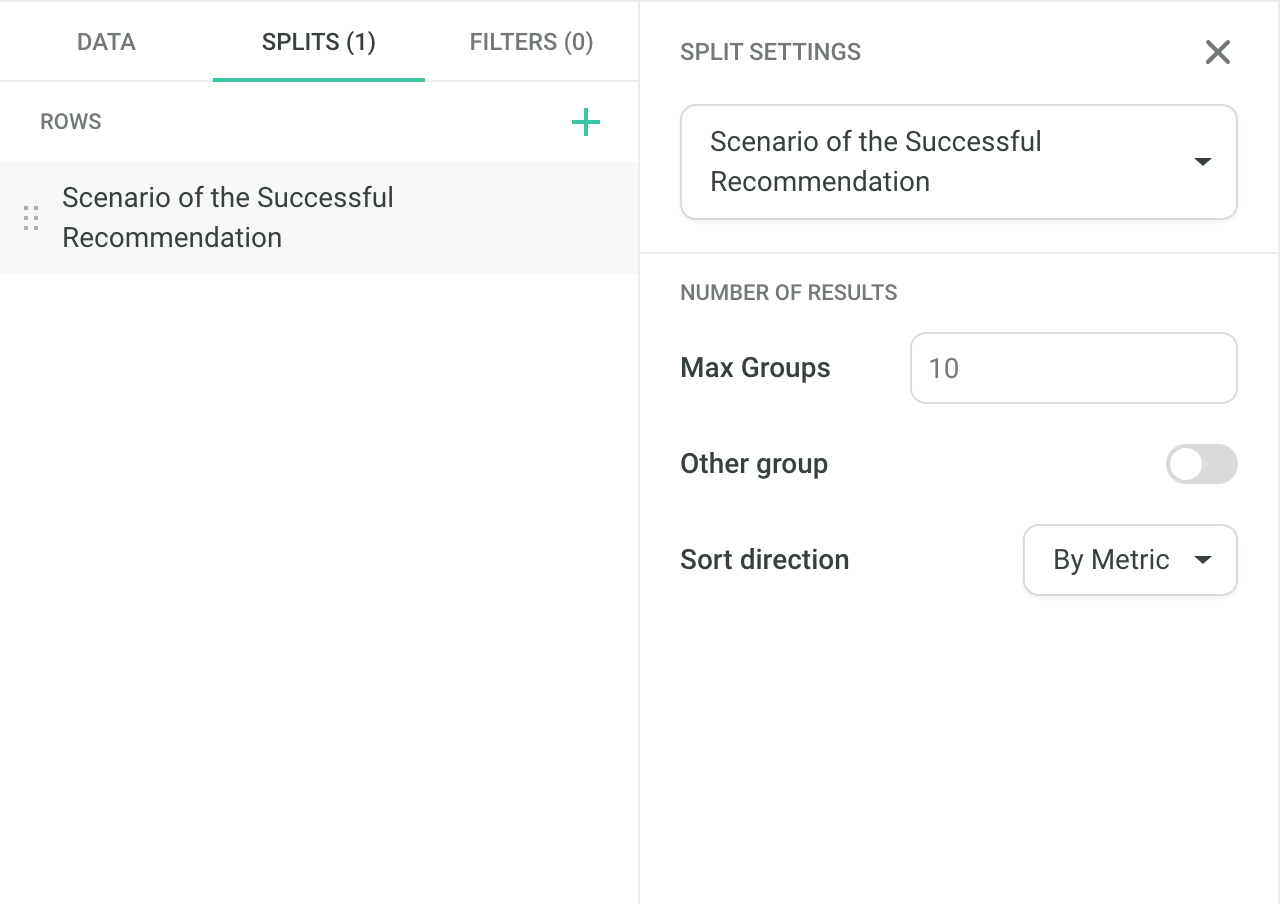
- The second one on the User ID
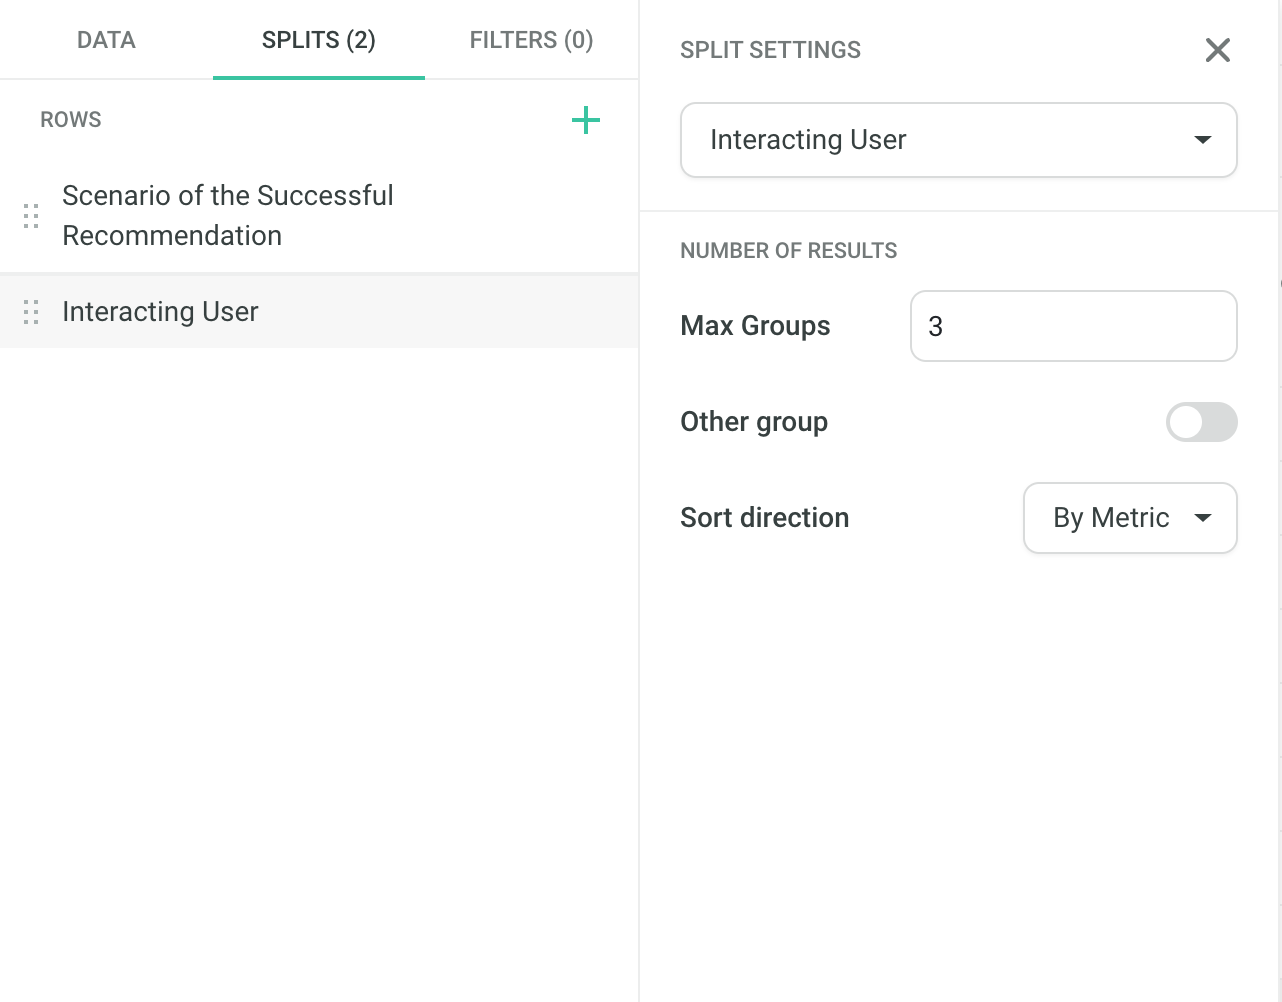
It works in the way that first the Scenarios with the highest Sum of Price of Purchases Based on Recommendations are selected.
For each of these top Scenarios, results for users with the highest Sum of Price of Purchases Based on Recommendations within the Scenario are presented.
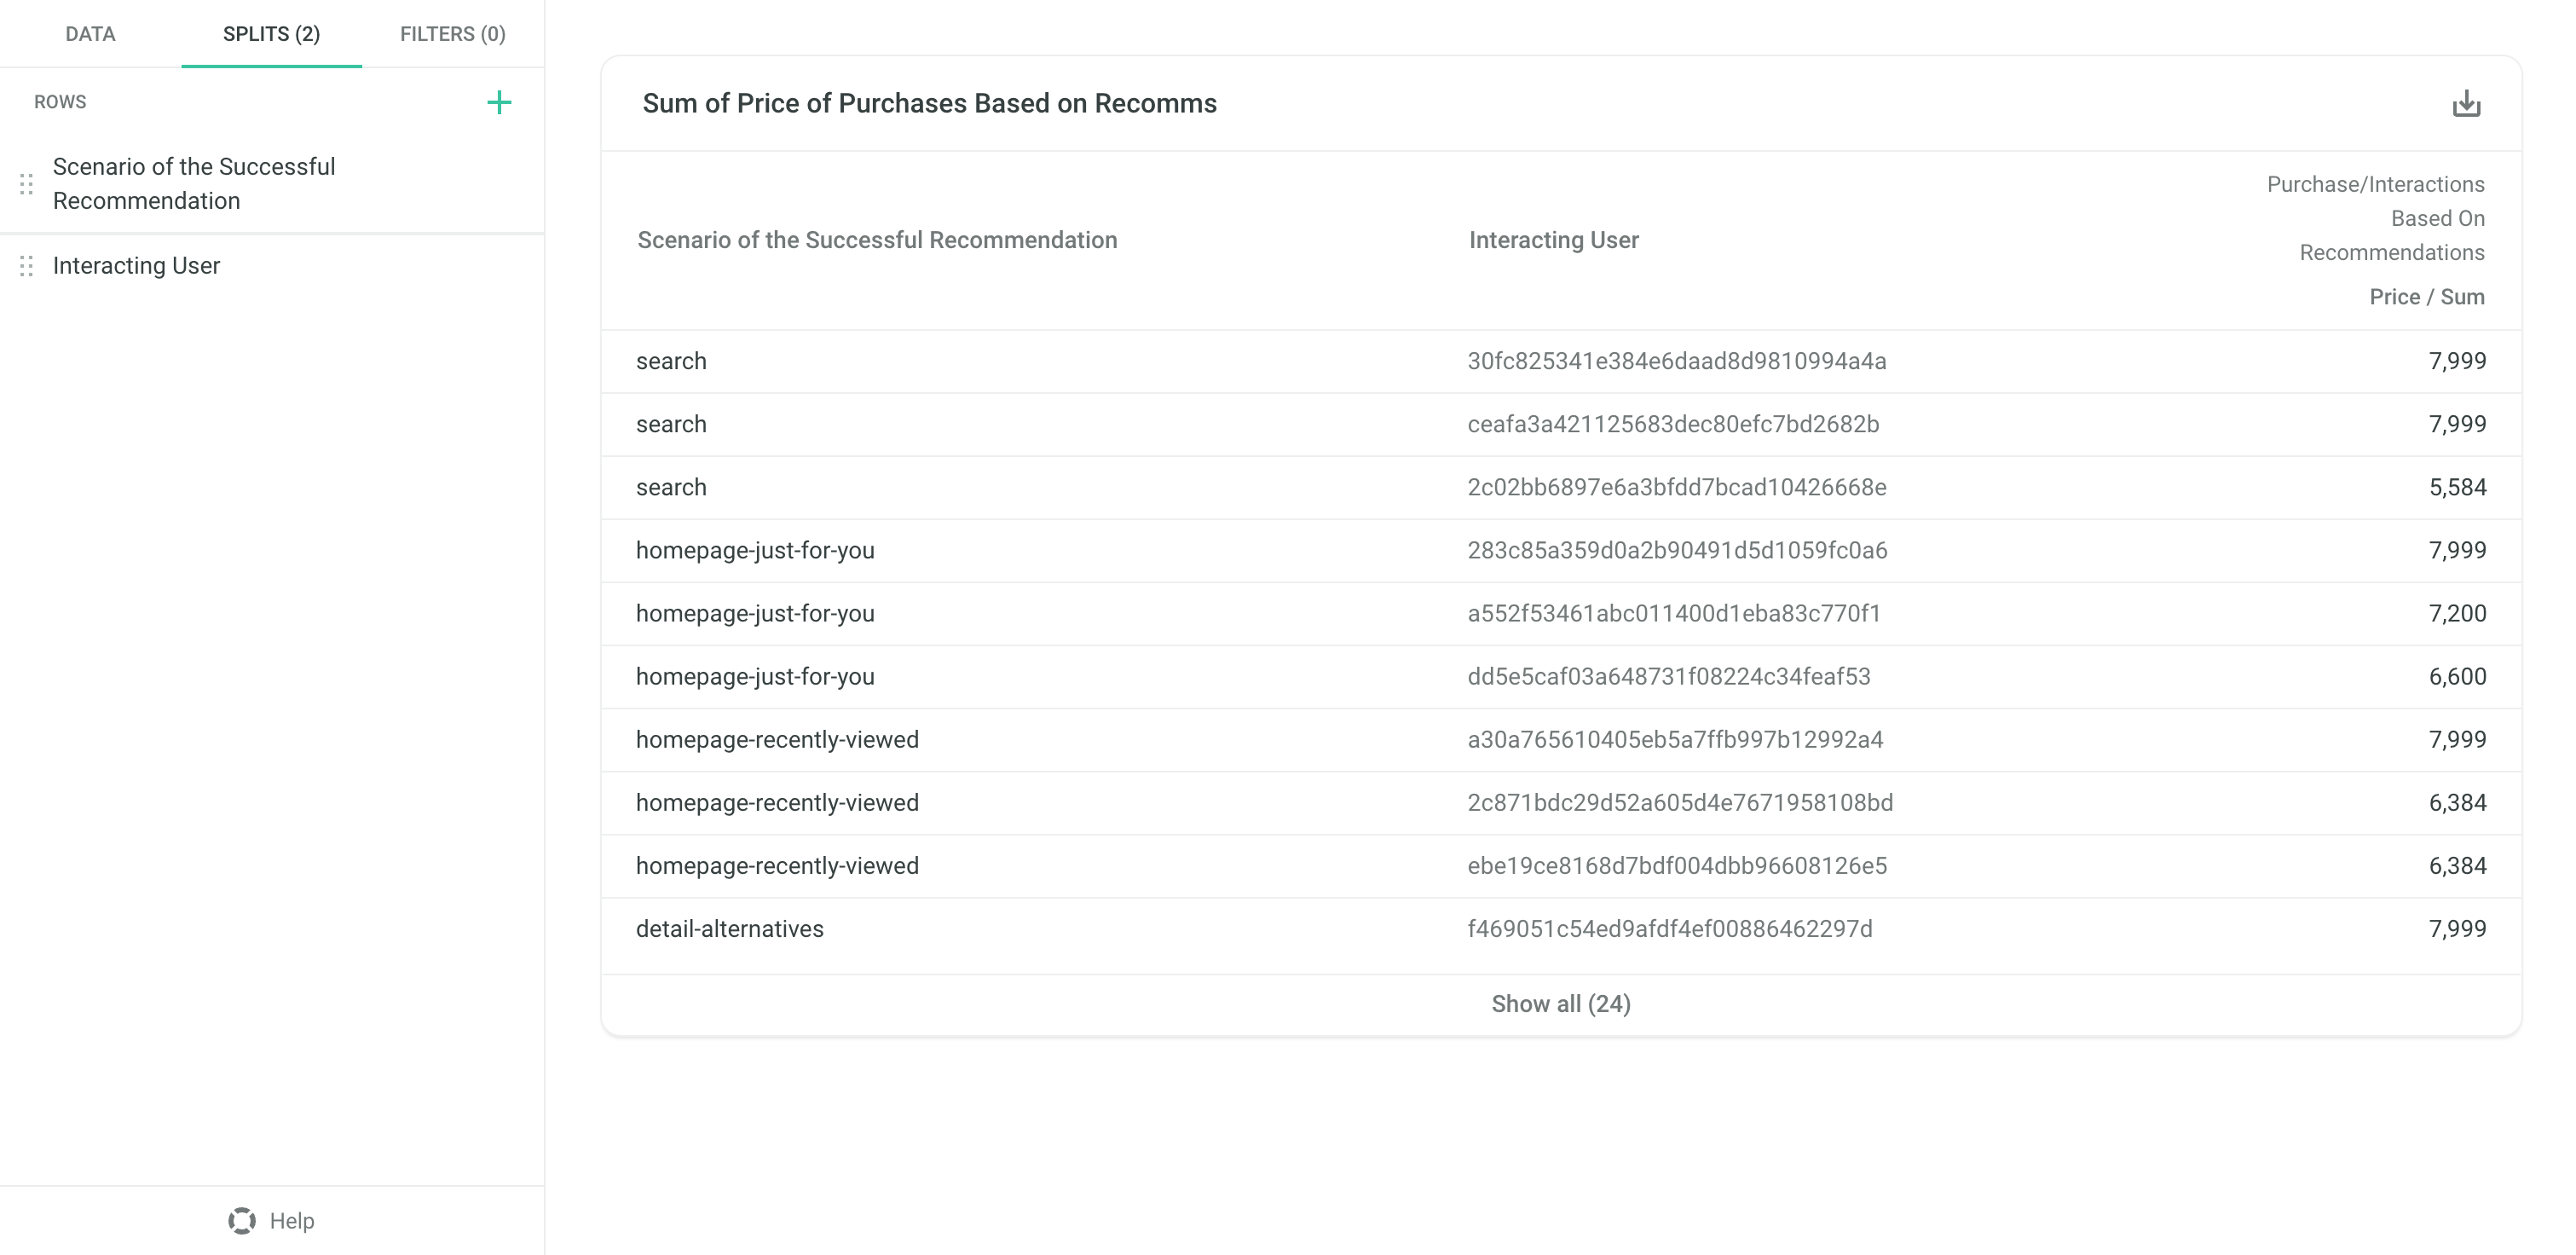
You can see that the order of the Splits matters: If you added the Split on User first and then the Split on Scenario, the top Users according to Sum of Price of Purchases Based on Recommendations would be selected (no matter the Scenarios), and for these users the sum of price would be split by the Scenario of the successful recommendation.
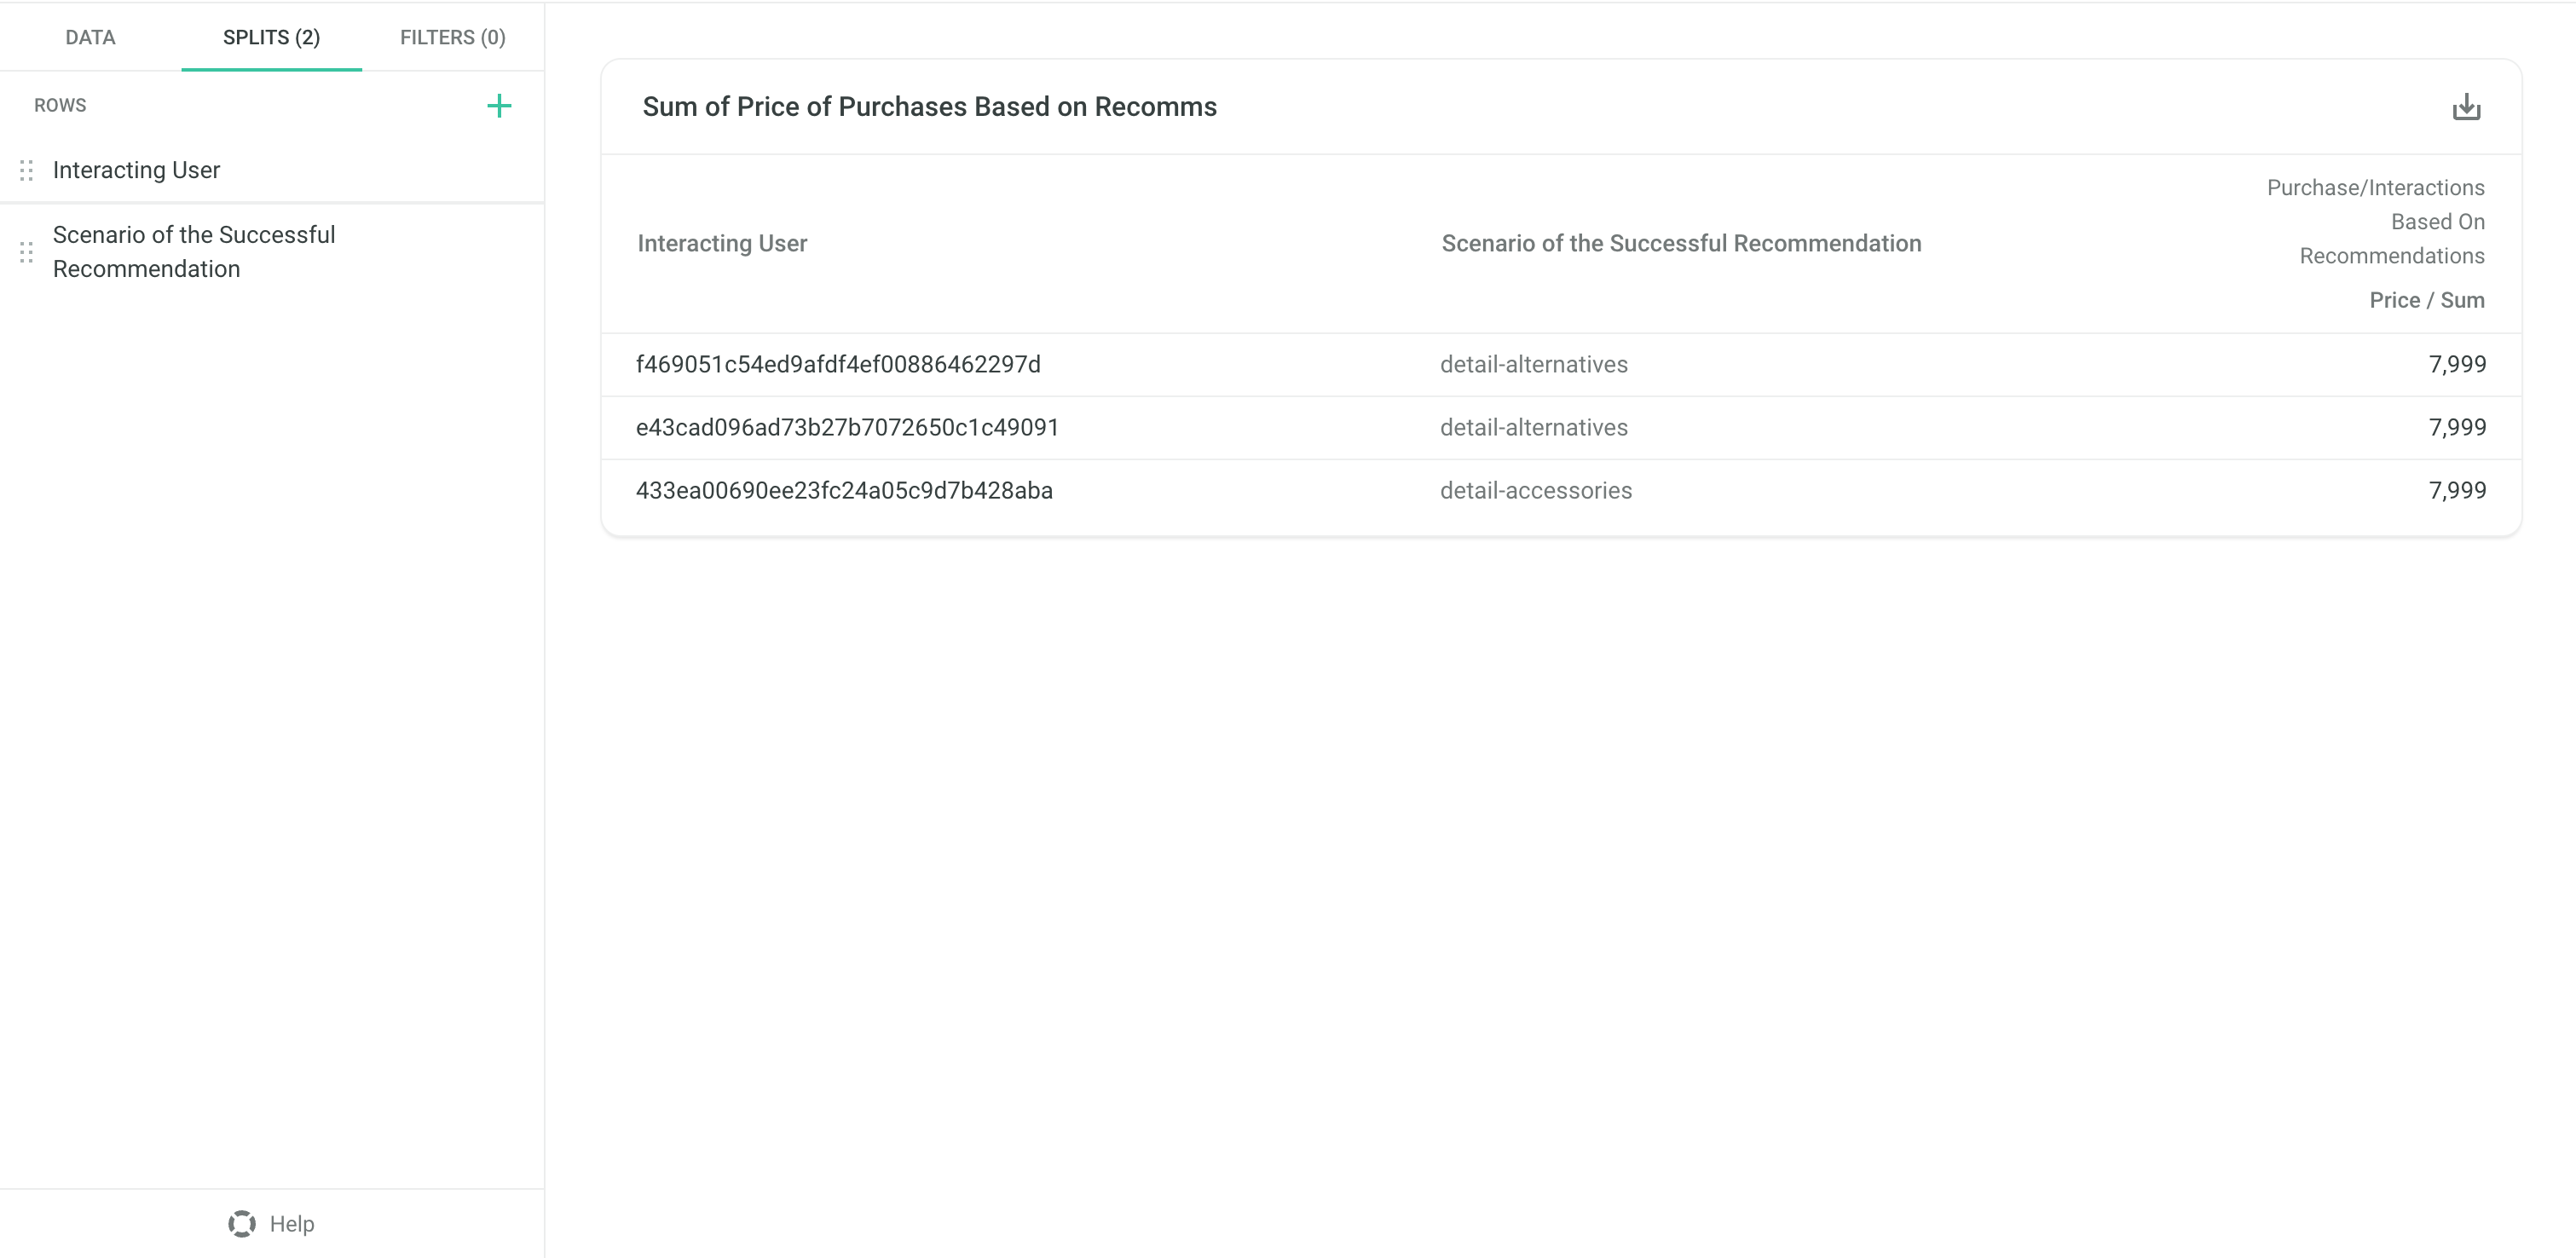
You can drag & drop the Splits in the list to change their order.
Sorting & Number of Results#
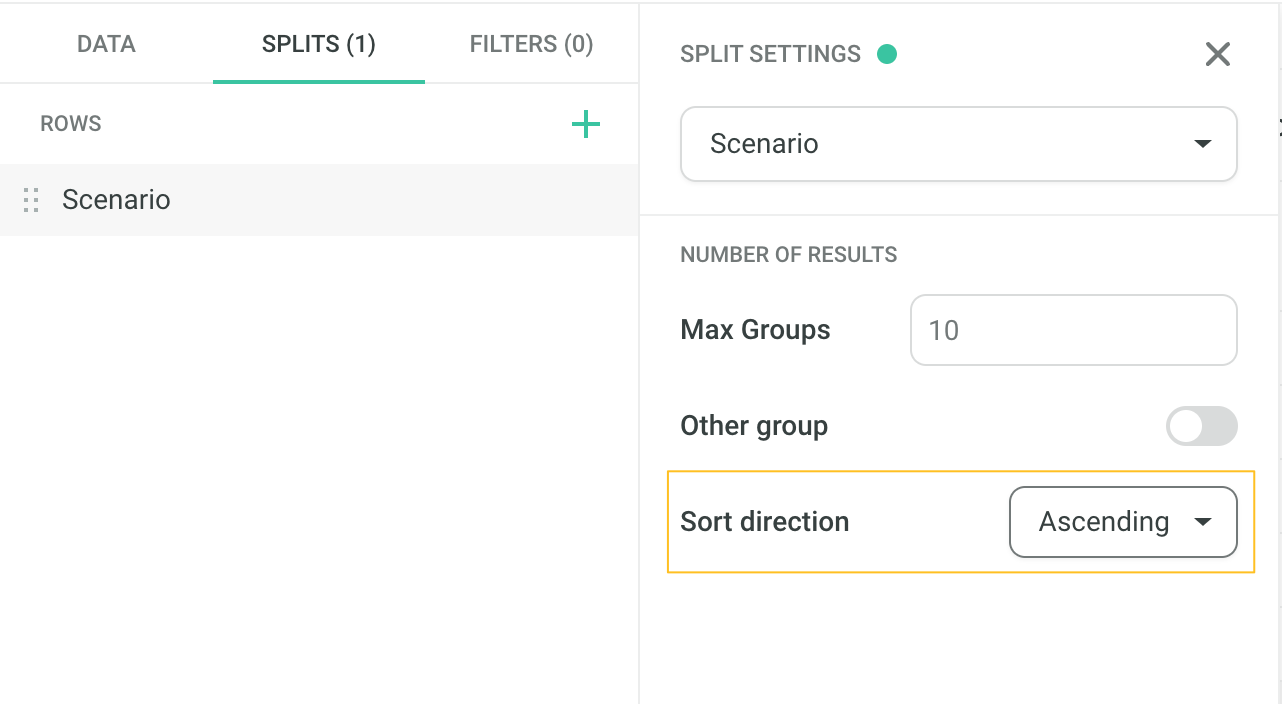
Sort Direction#
By default, the resulting split groups are ordered by the Metric: For example, in the case of Count of Recommendation Requests Data Source and split by Scenario, you will get the Scenarios with the highest number of recommendation requests during the time period (in descending order by the count).
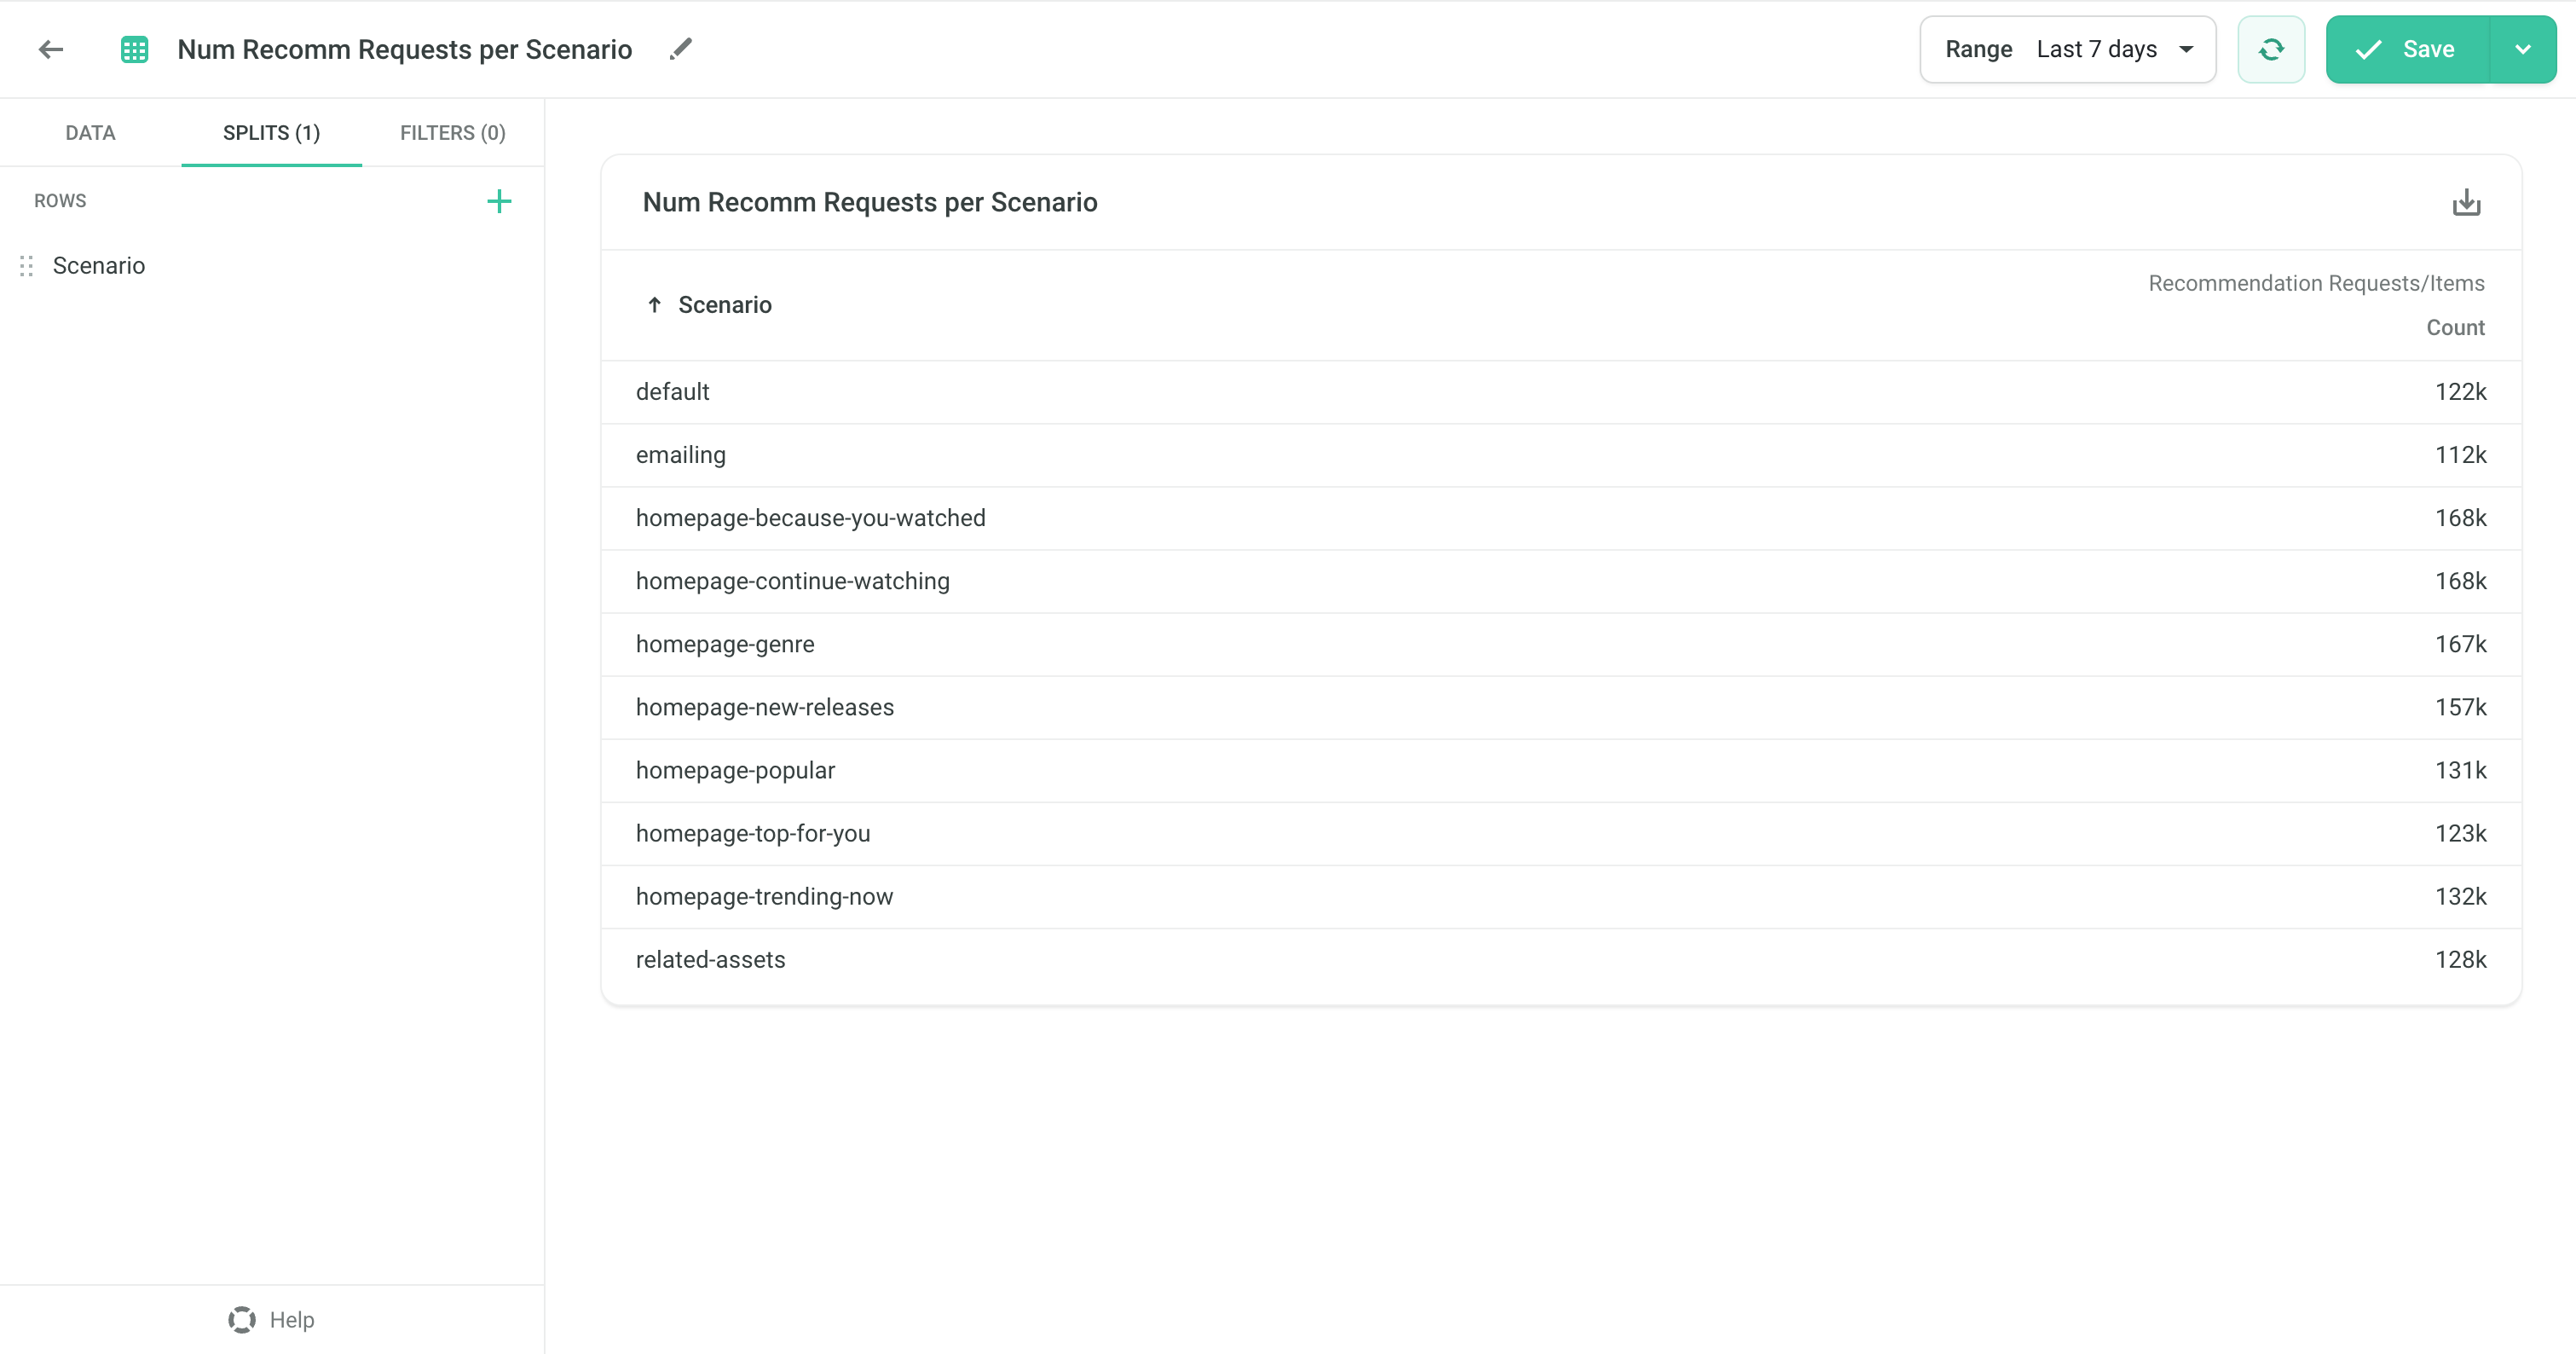
If you would instead want to order by the values from the Split themselves, in this case, the Scenarios, you can change the Sort Direction to Ascending or Descending, and you will get Scenarios ordered alphabetically in ascending or descending order.
↓
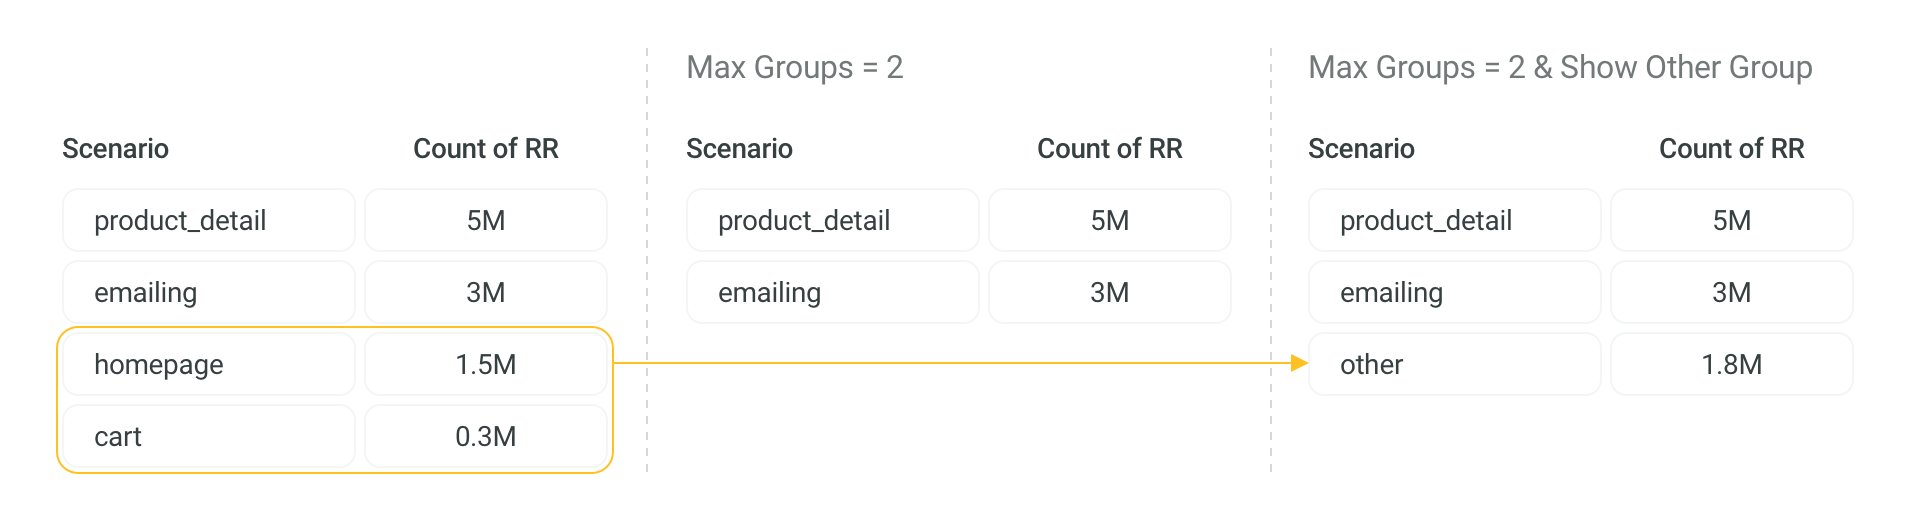
Number of results#
You can limit the number of groups produced by the Split by setting the Max Groups parameter (default: 10). It will show at most this number of top groups according to the Sort direction.
If there are more groups in the data than Max Groups, you can see the aggregate of all the other groups by enabling the Other Group option.
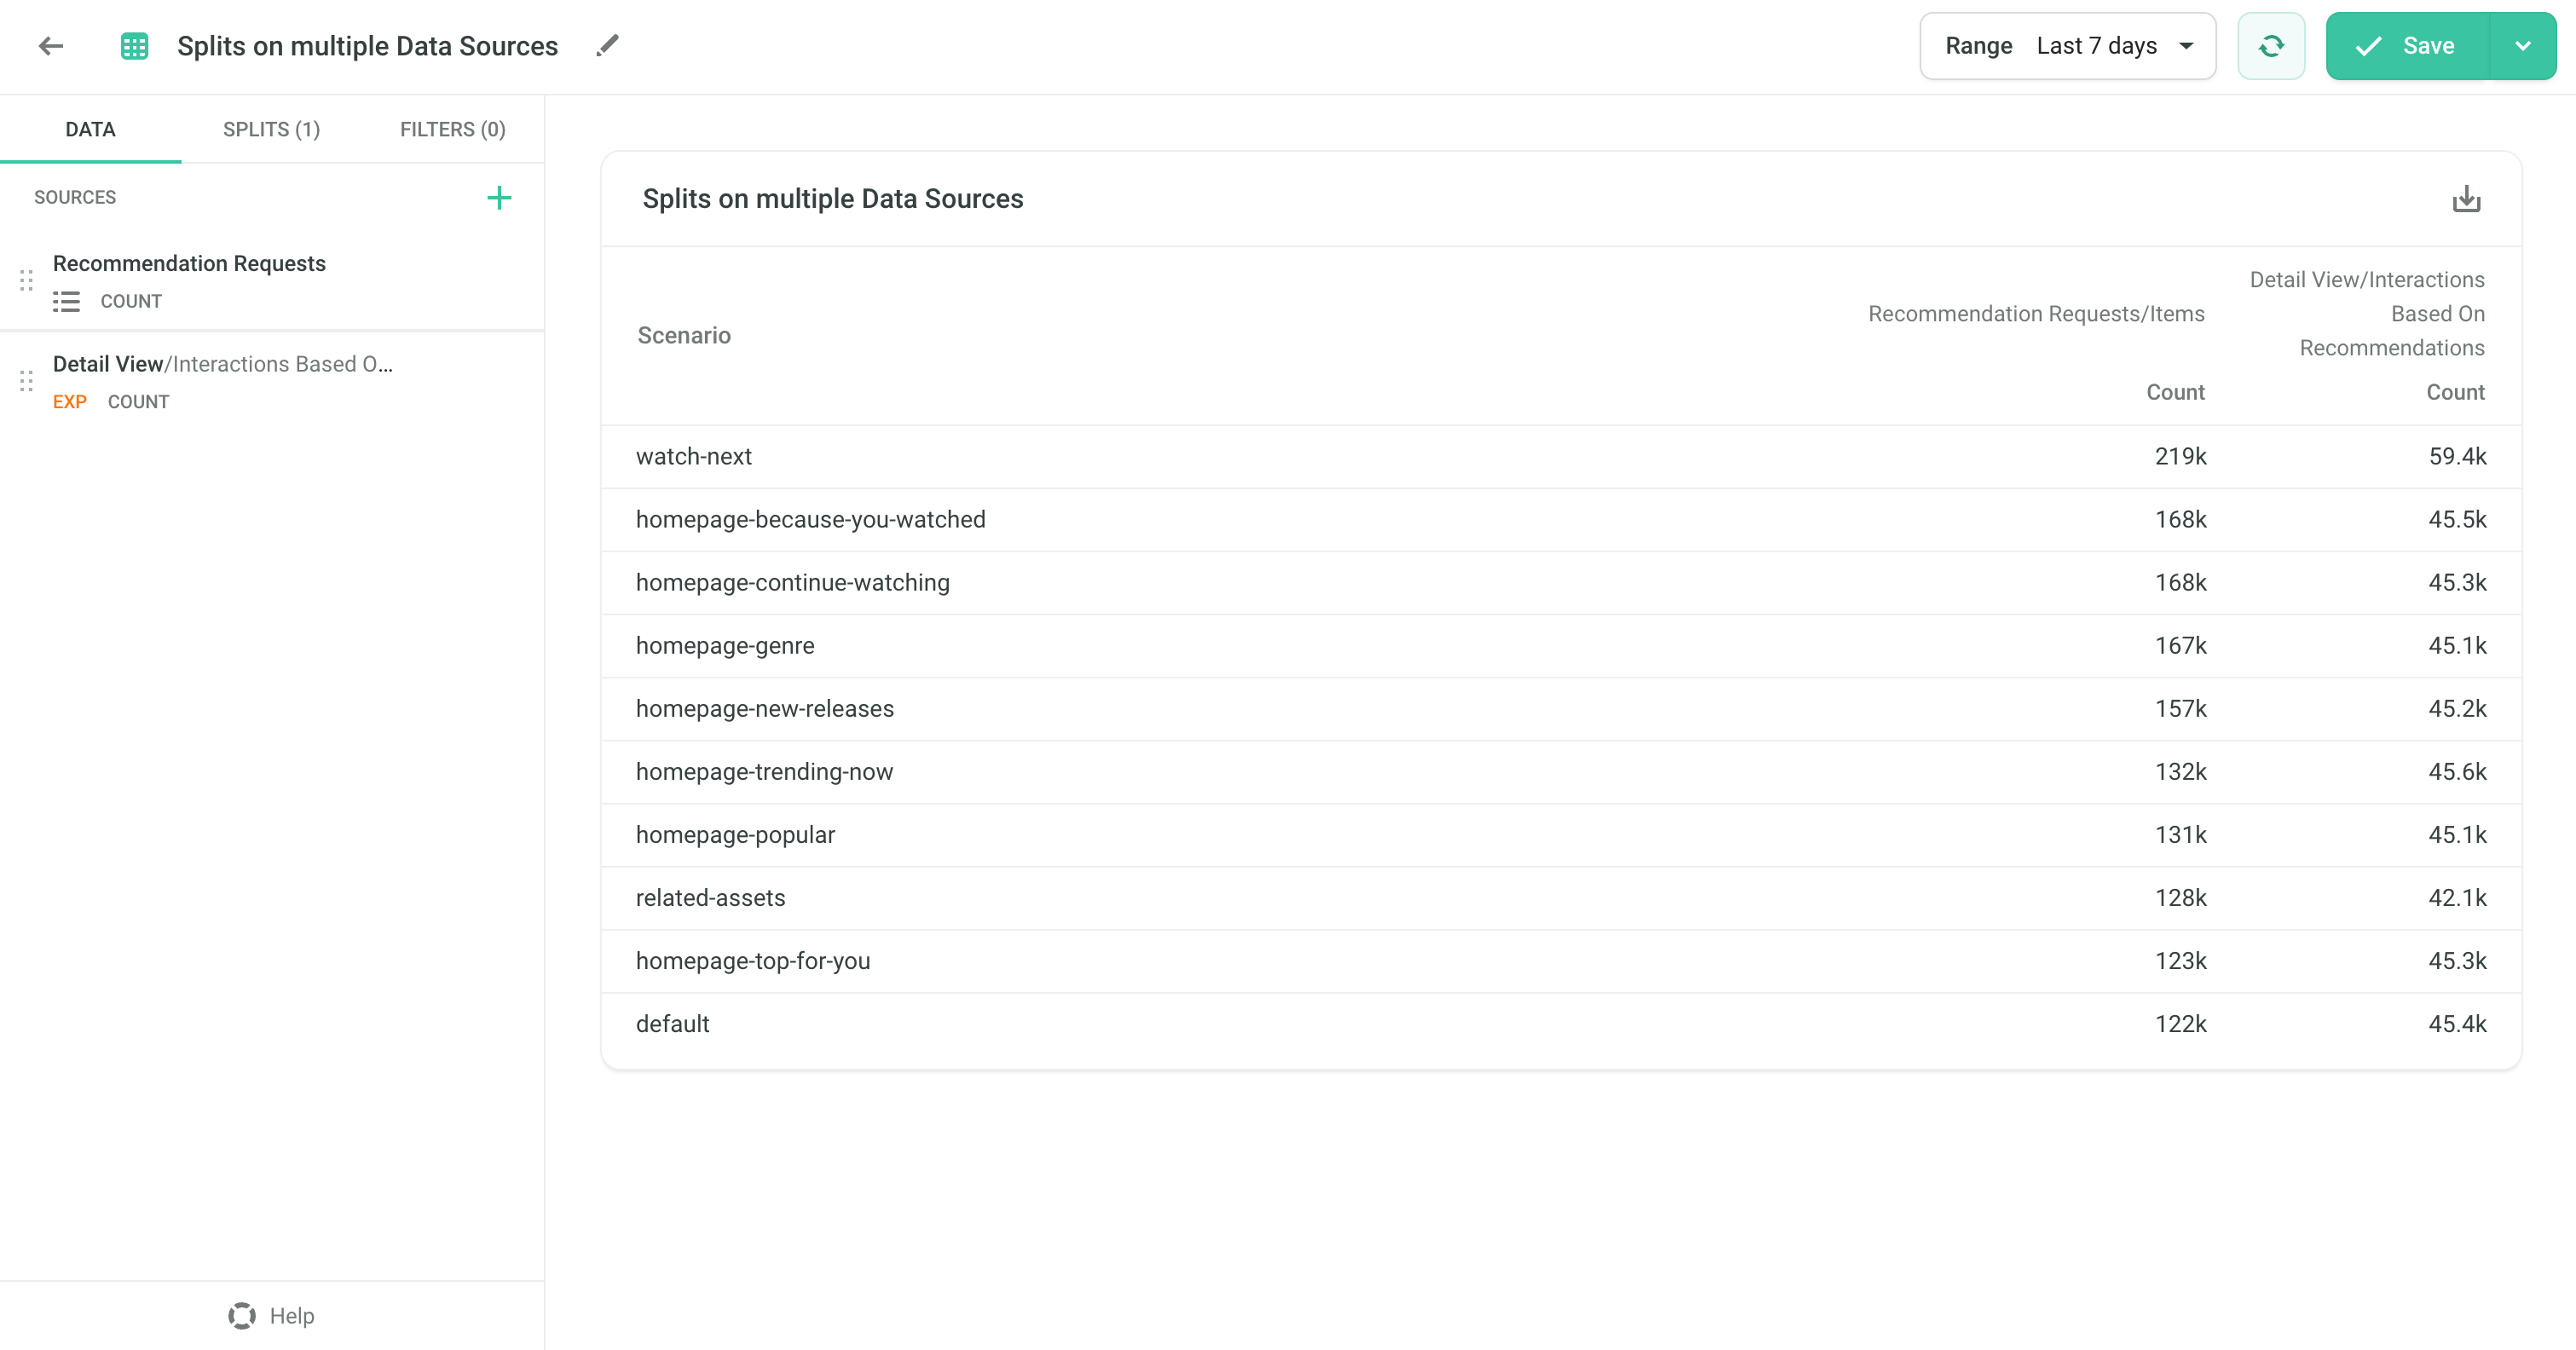
Splits on multiple Data Sources#
If you have multiple Data Sources, then their order matters: The Split groups are picked according to the first Data Source in the list.
For example, if you have two Data Sources: Recommendation Requests and Detail Views Based on Recommendations with a Scenario Split, then the Scenarios with the highest count of Recommendation Requests are selected, and for these Scenarios the count of Detail Views Based on Recommendations is displayed.
If the Data Sources were in a different order: Detail Views Based on Recommendations first and Recommendation Requests second, then the picked Scenarios depend on the number of Detail Views Based on Recommendations.
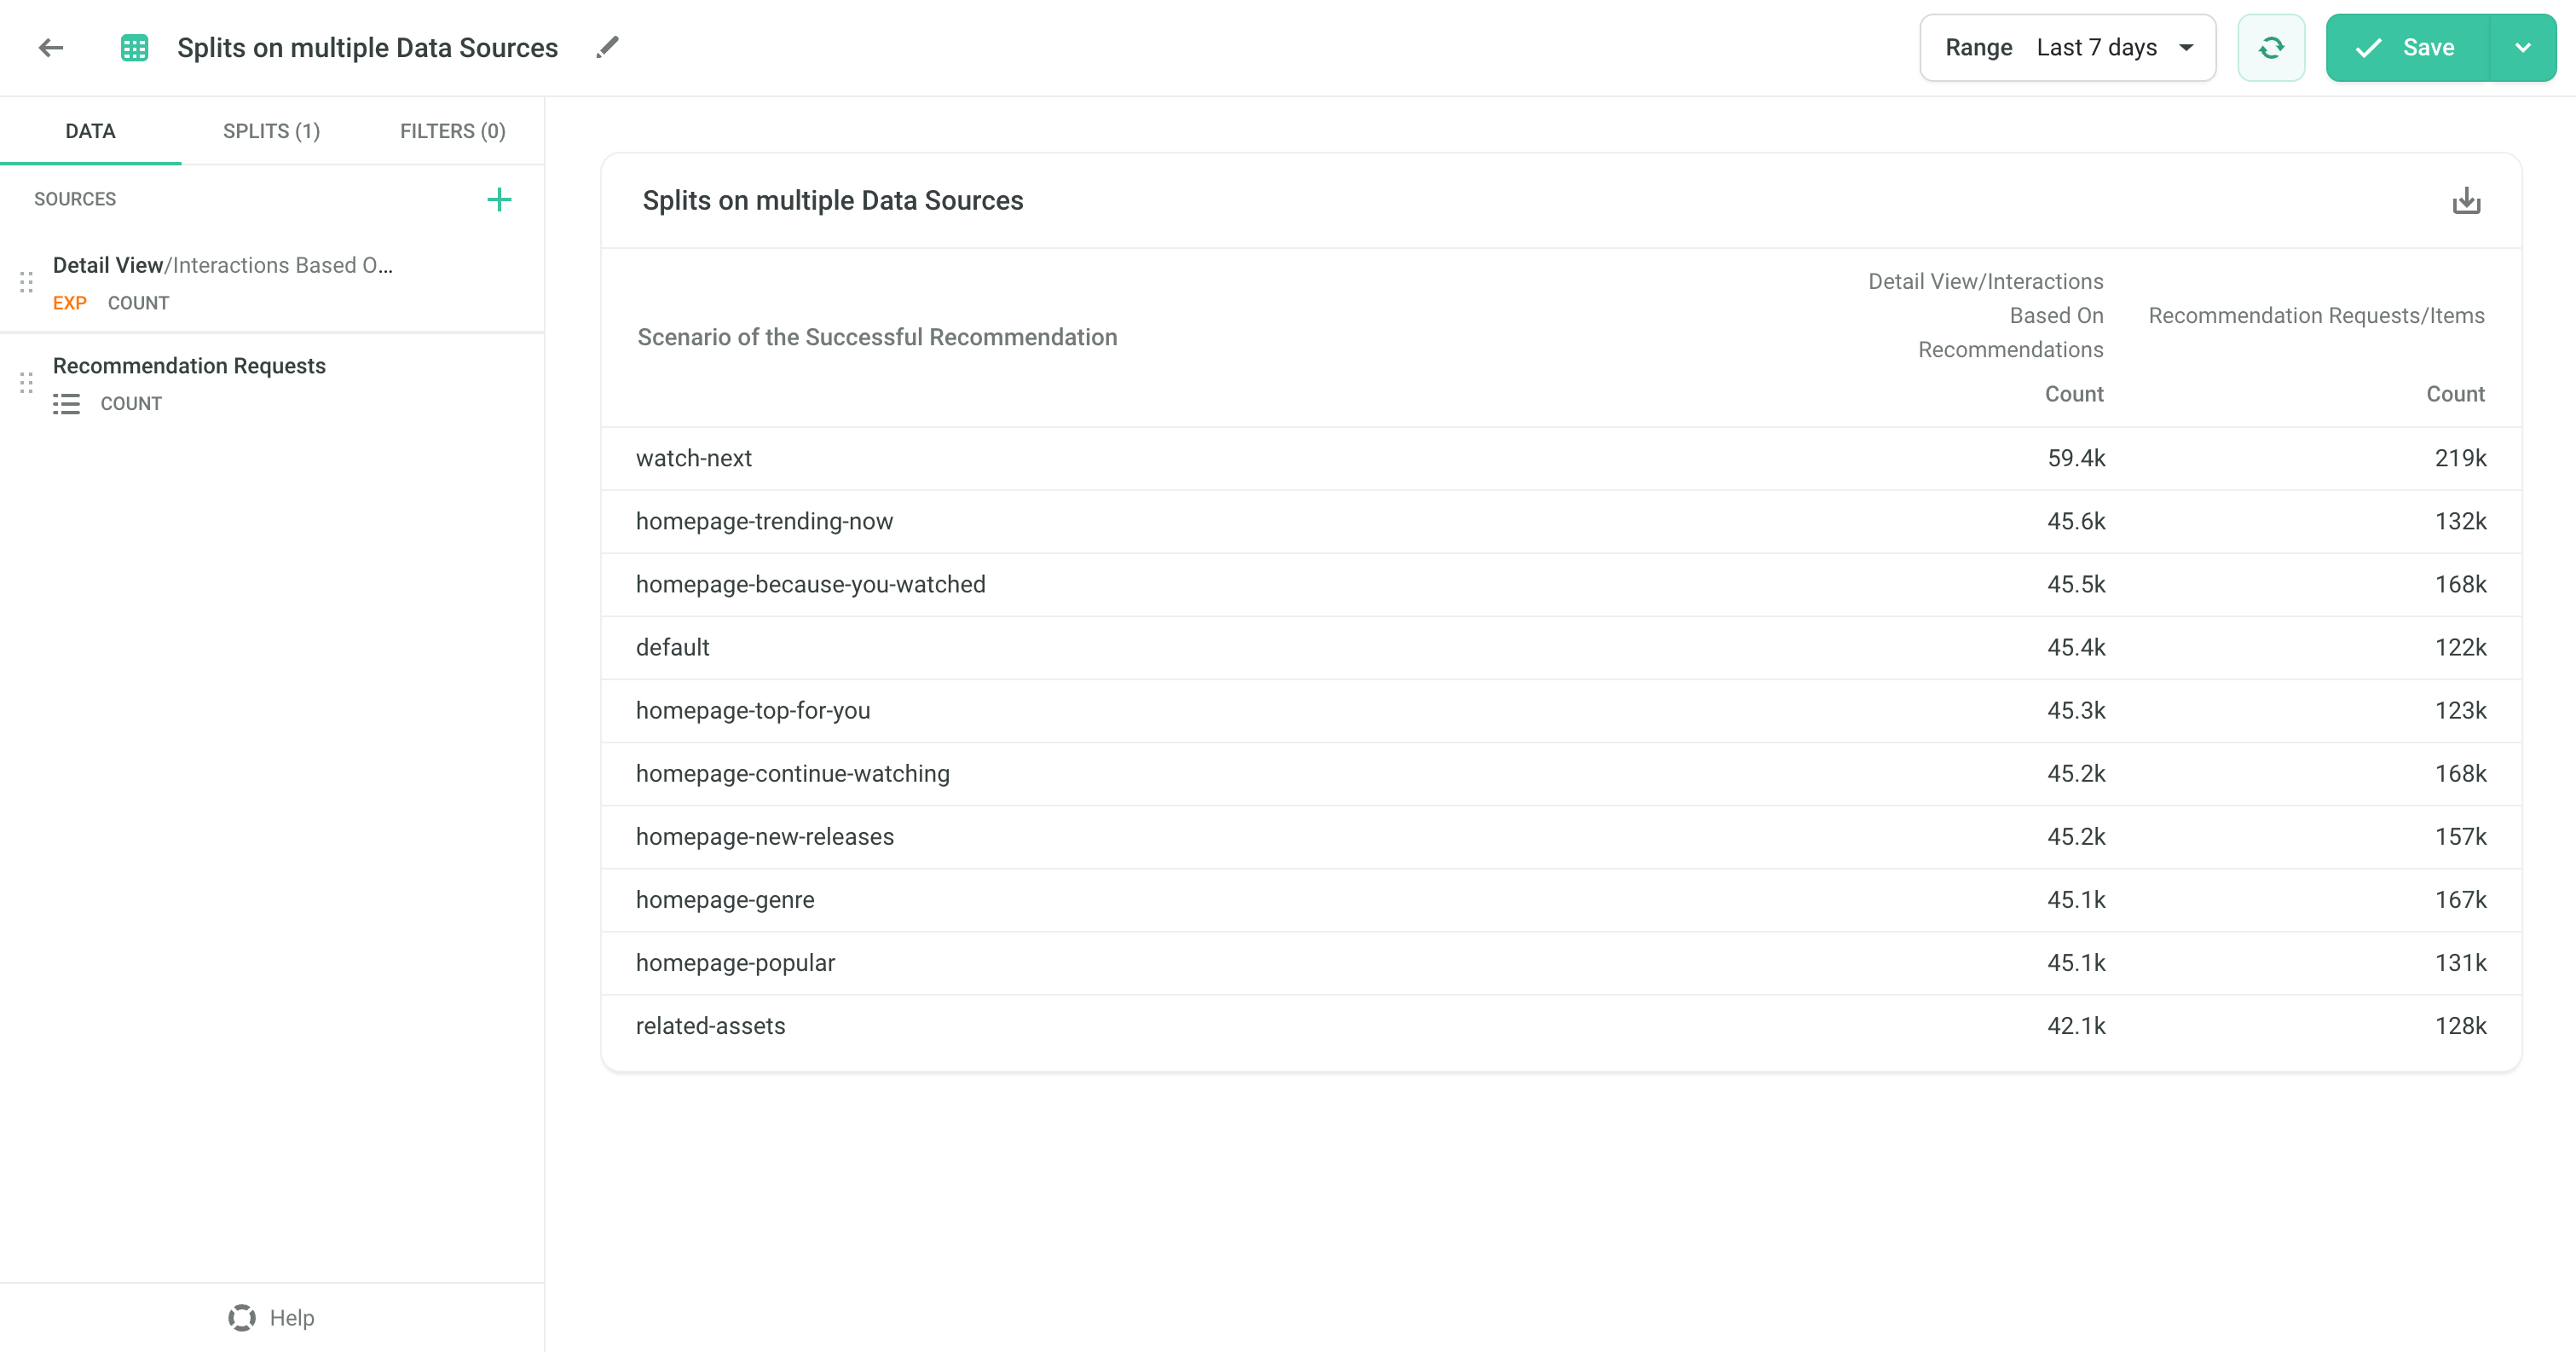
You can drag & drop the Data Sources in the list to change their order.
Splitting by Item Property of the type set#
If you split by an Item Property of type set (which contains multiple values), or by a Segmentation that gives multiple Segments for an Item, the Item is counted towards each yielded item property value / Segment.
Example#
Assume Count of Recommended Items Data Source:
If there are Items with their genres property set to {"action", "science_fiction"}, then after adding the Split on the genres property, those Items are counted towards both genres: