A/B Testing
A/B Testing lets you compare different recommendation configurations within a Scenario and measure their effect on your key metrics. Each experiment runs on top of a specific Scenario, with traffic split between a Control (the current Scenario configuration) and one or more Variants.
Setting Up an Experiment
You can create an experiment either from the A/B Testing tab inside a Scenario's detail view, or from the standalone A/B Testing section in the Admin UI.
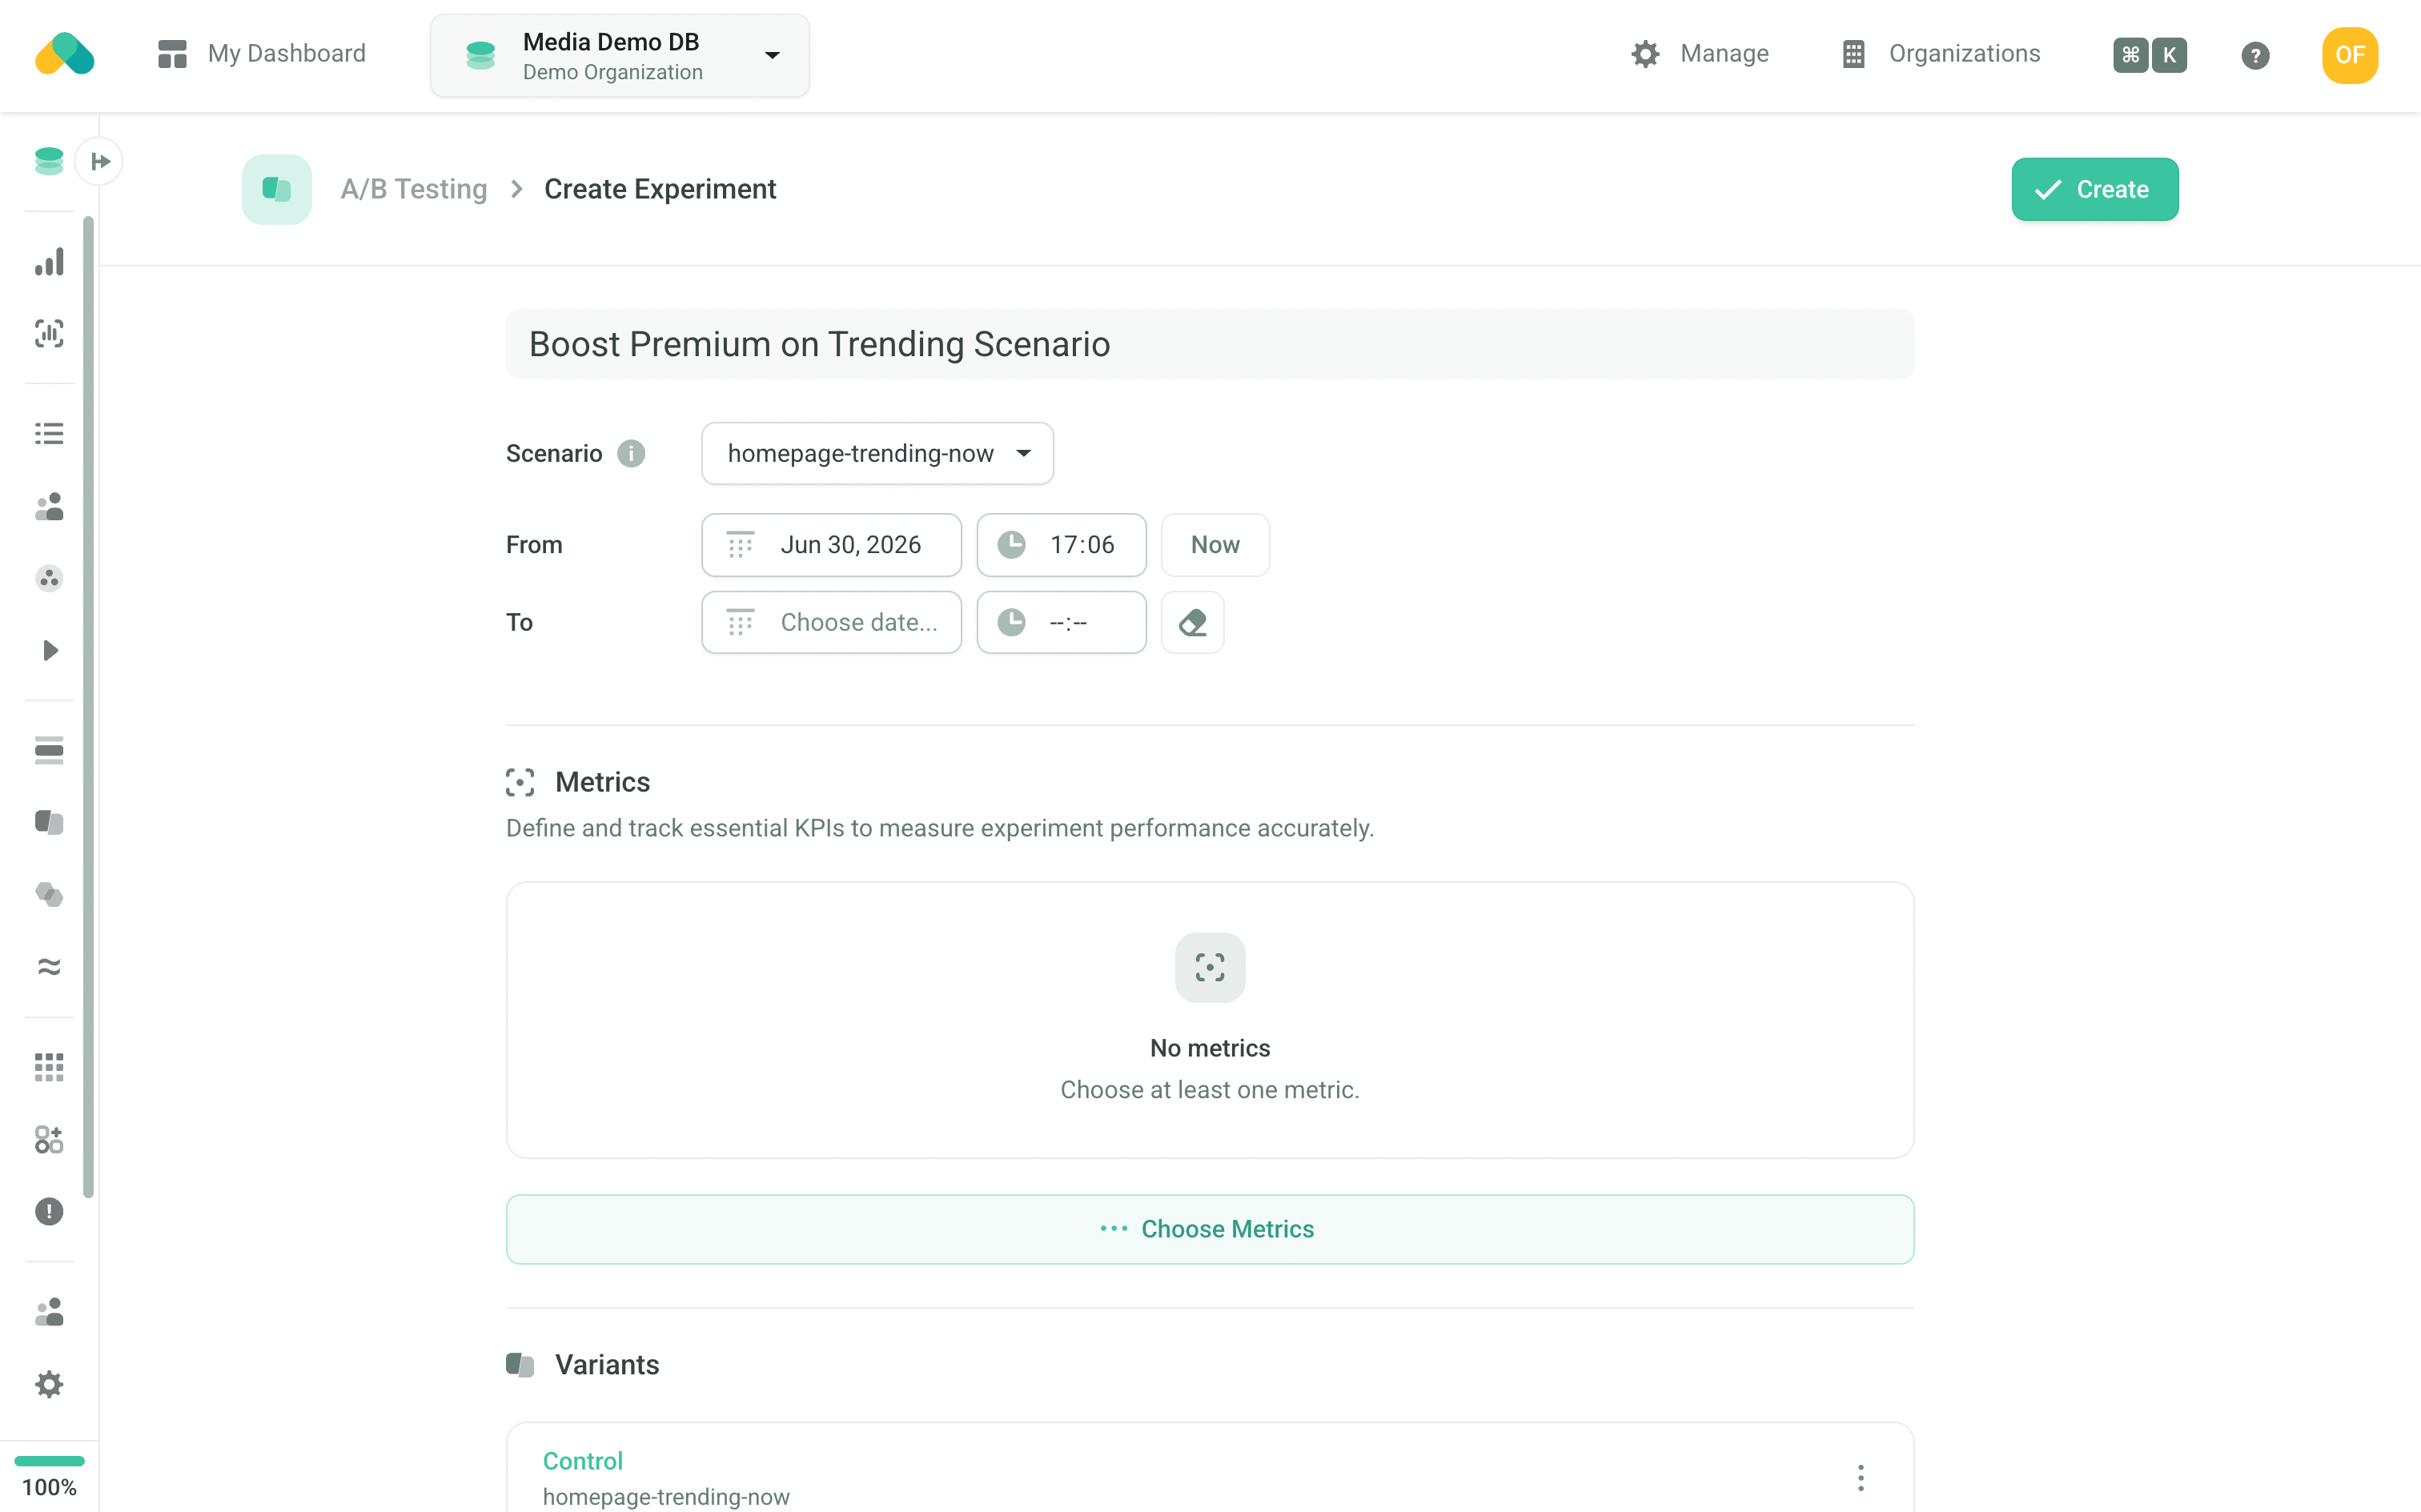
When creating an experiment, provide a title (or leave it blank to have one generated automatically), then select the Scenario it should run on. Set the start date — and optionally an end date — to define the experiment's time window.
Metrics
Metrics define what you want to measure. You must choose at least one metric before the experiment can be created.
Recombee provides a library of predefined metrics organized by vertical (Video, E-Commerce, Articles & News, etc.) — including metrics such as Conversion Rate, Click-Through Rate (CTR), Watch Time from Recommendations, and Income from Recommendations.
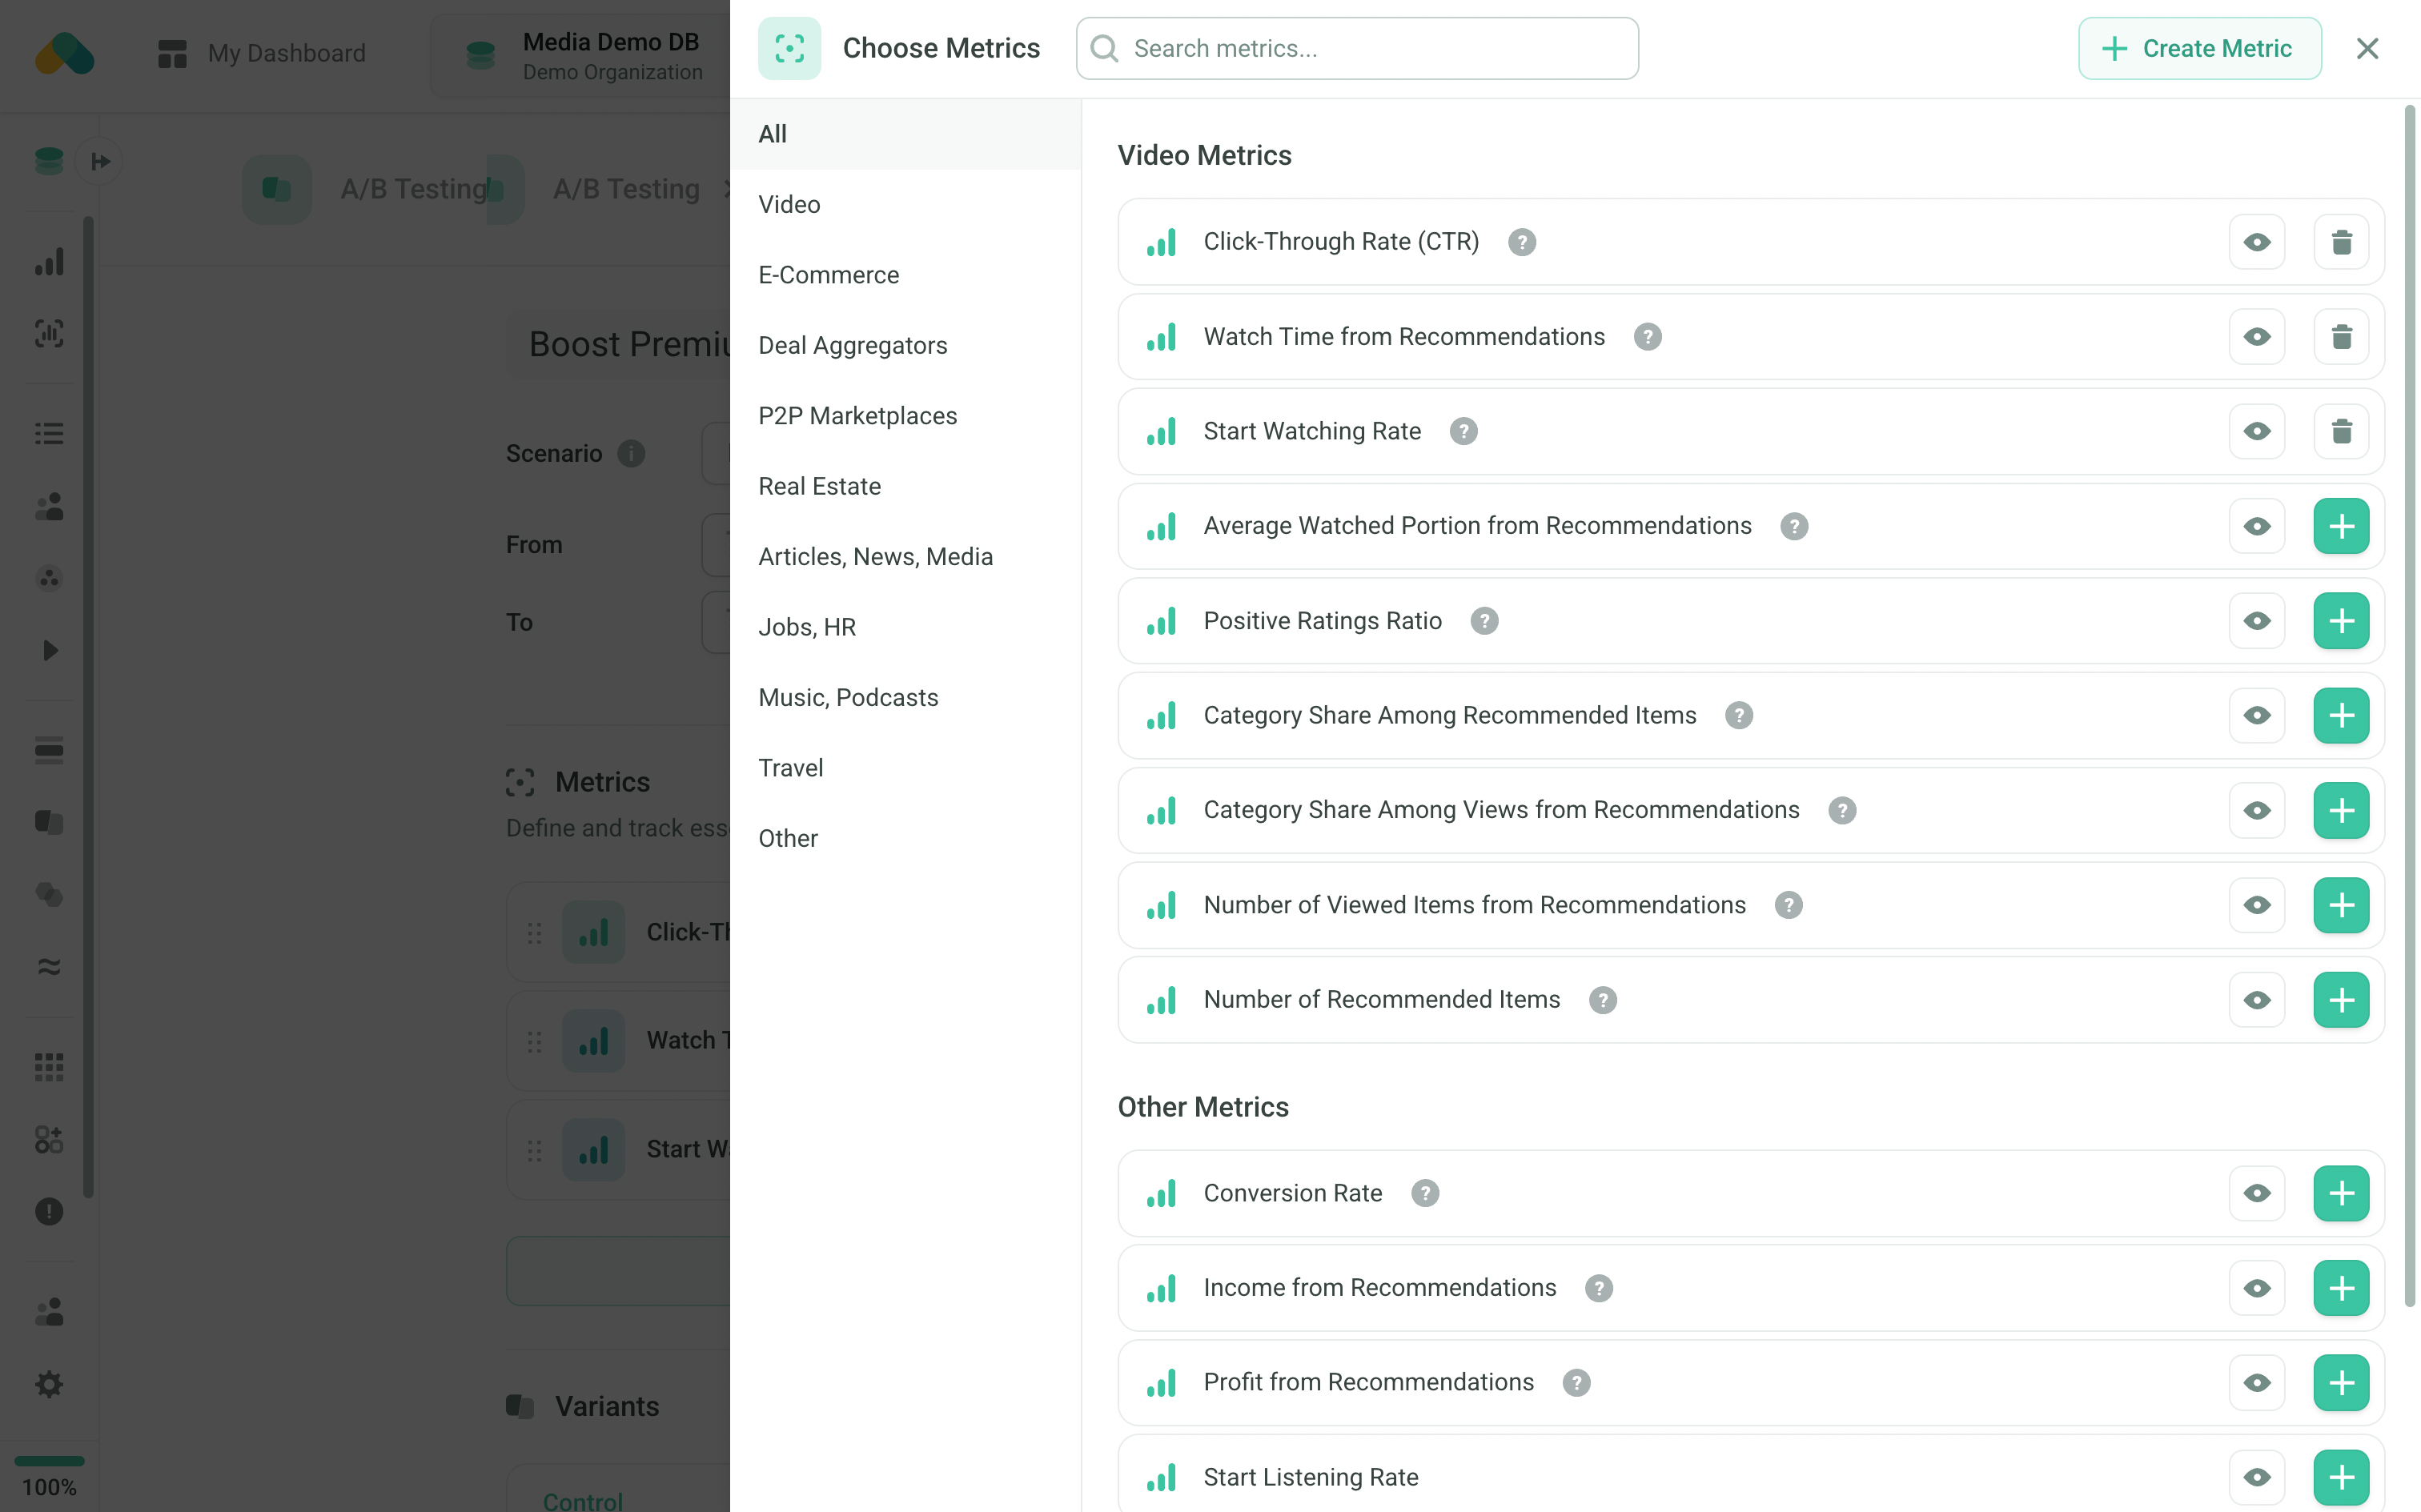
You can also create custom metrics based on Insights. A custom metric lets you specify a data source (e.g., Detail Views from Recommendations) and apply filters — for example, to track views from recommendations only for items from a particular category, or to measure the purchase rate exclusively for items above a certain price threshold.
Variants
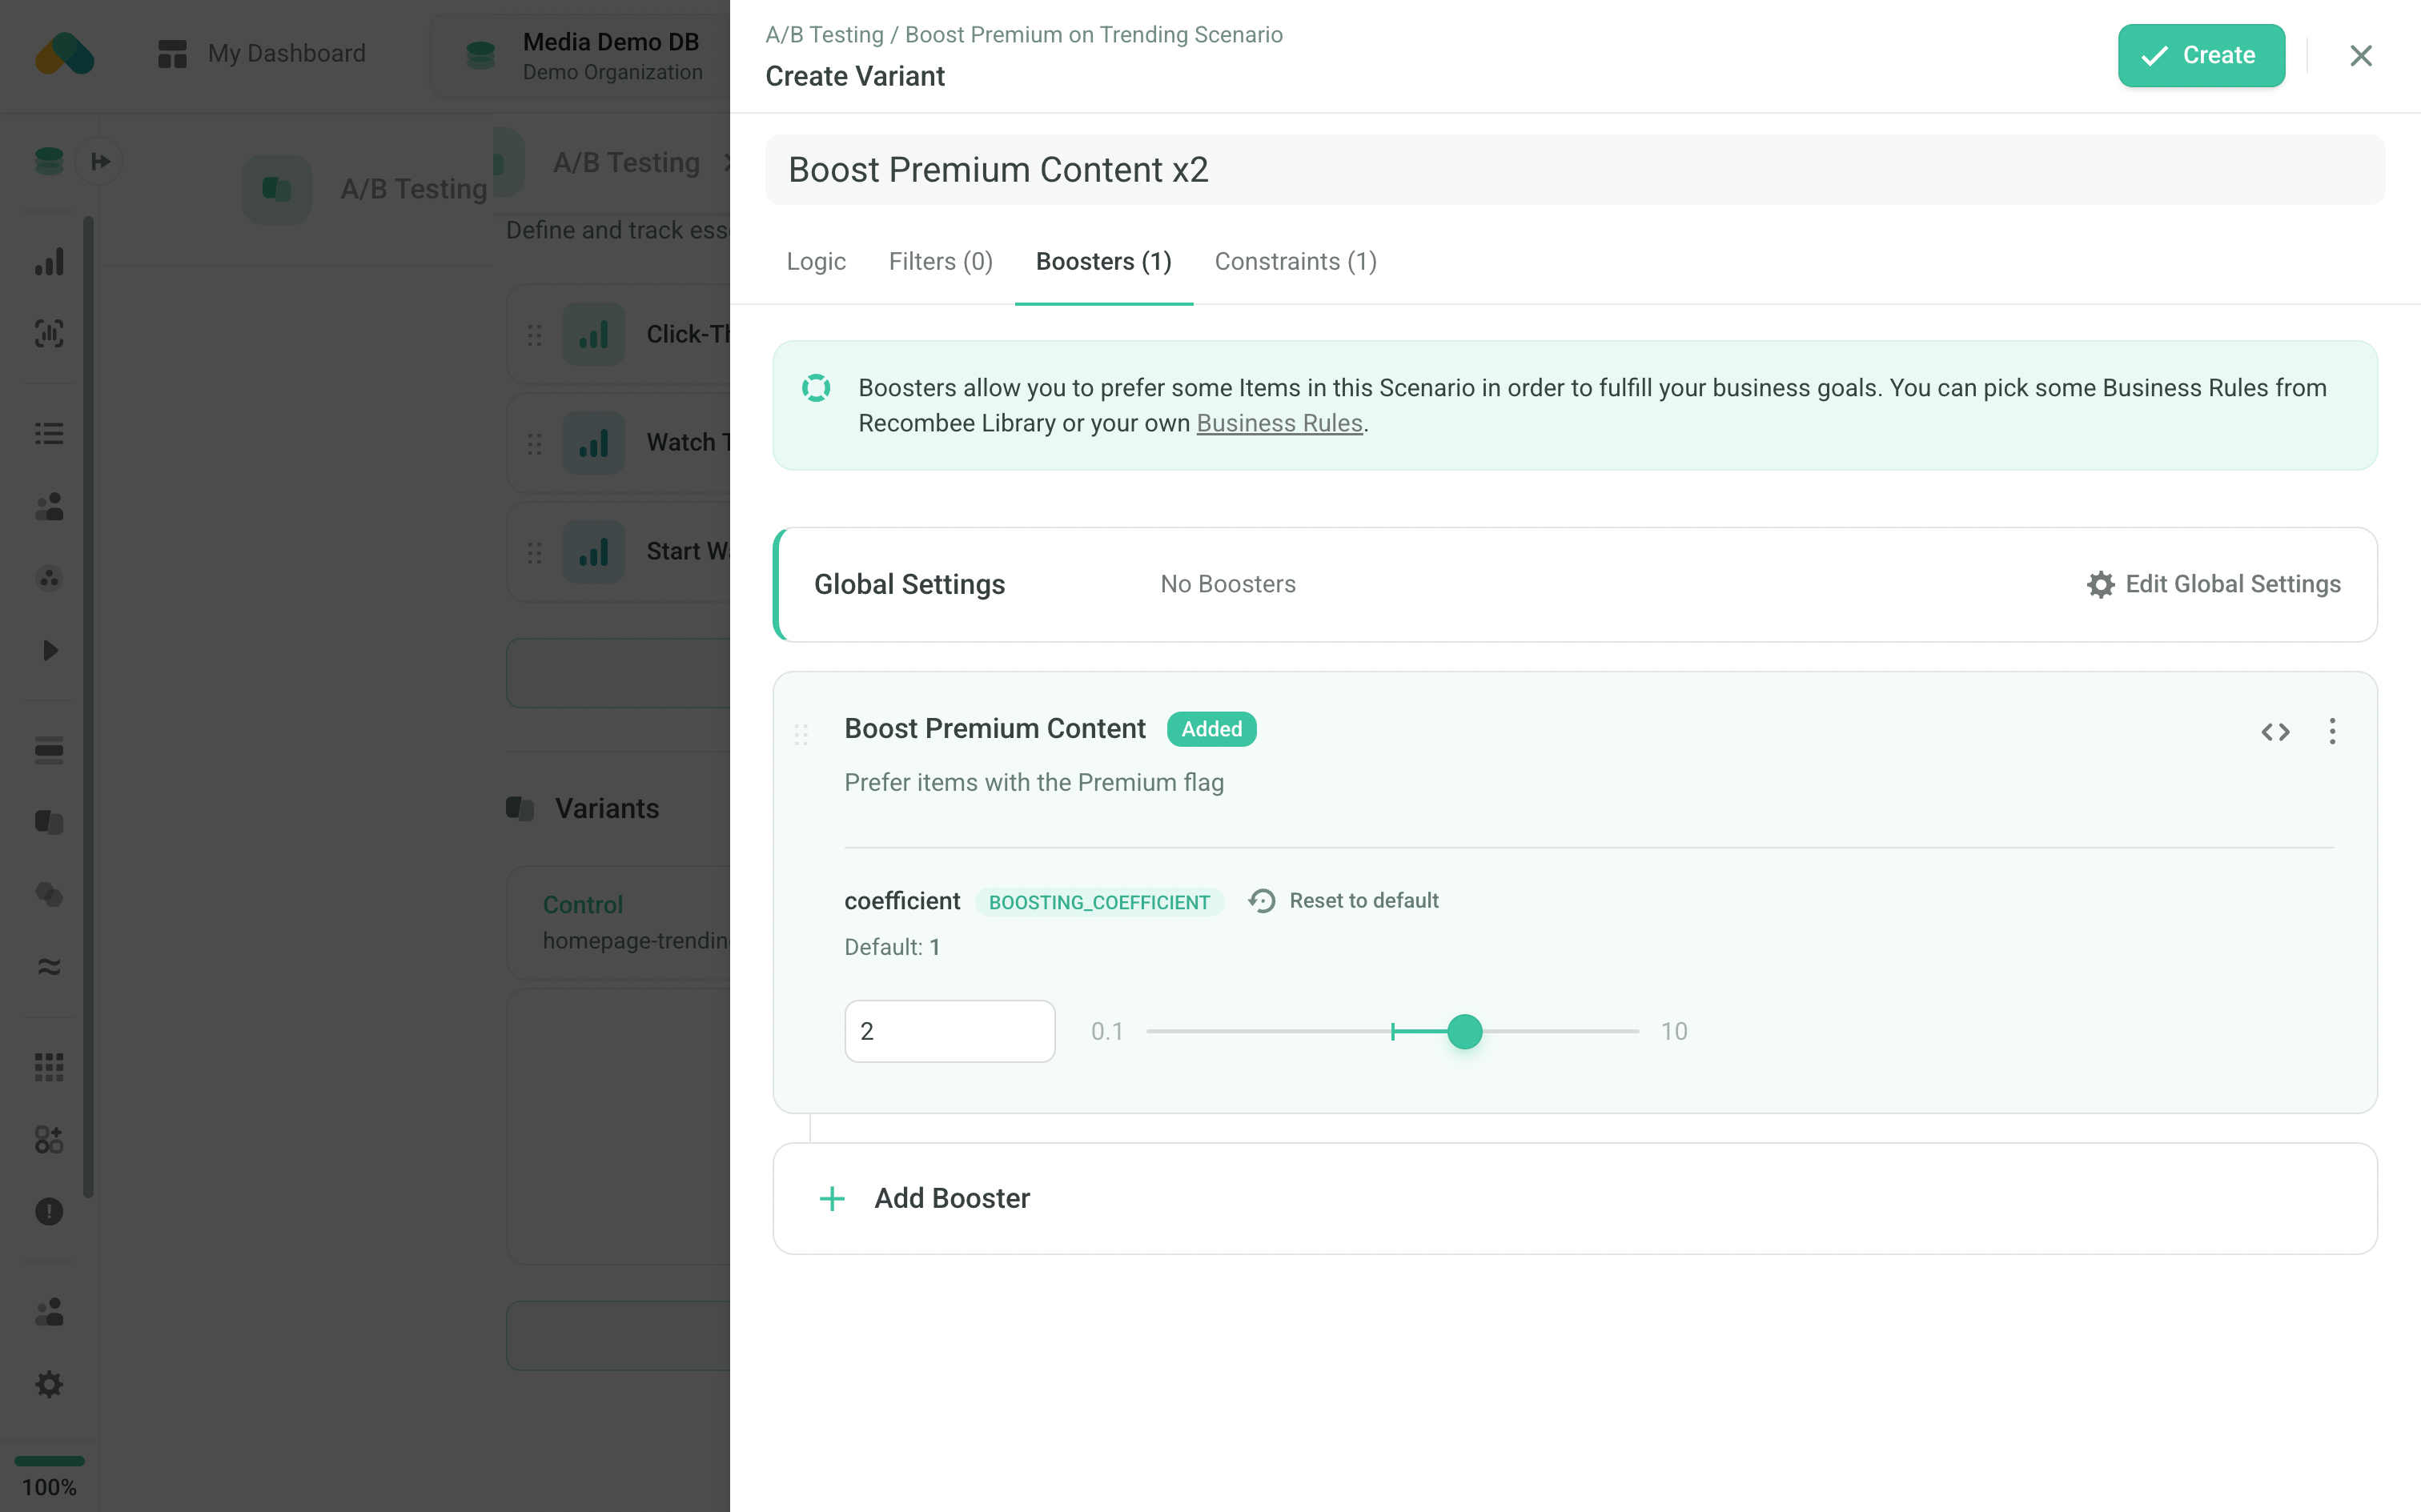
Each experiment has a Control — the Scenario's current configuration — and one or more Variants that modify it.
When creating a Variant, you can change any combination of:
- Logic — the whole recommendation model ensemble or its individual parameters
- Filters — which items are eligible to be recommended
- Boosters — how items are ranked within results
- Constraints — limits on how frequently certain Segment of items appear
The Admin UI clearly shows what has been changed in each Variant relative to the Control.

Once Variants are defined, assign a traffic allocation (percentage) to each using the sliders. Use the lock icon to fix a Variant's allocation so it is not affected when adjusting others. Click Distribute Evenly to split traffic equally across all Variants.
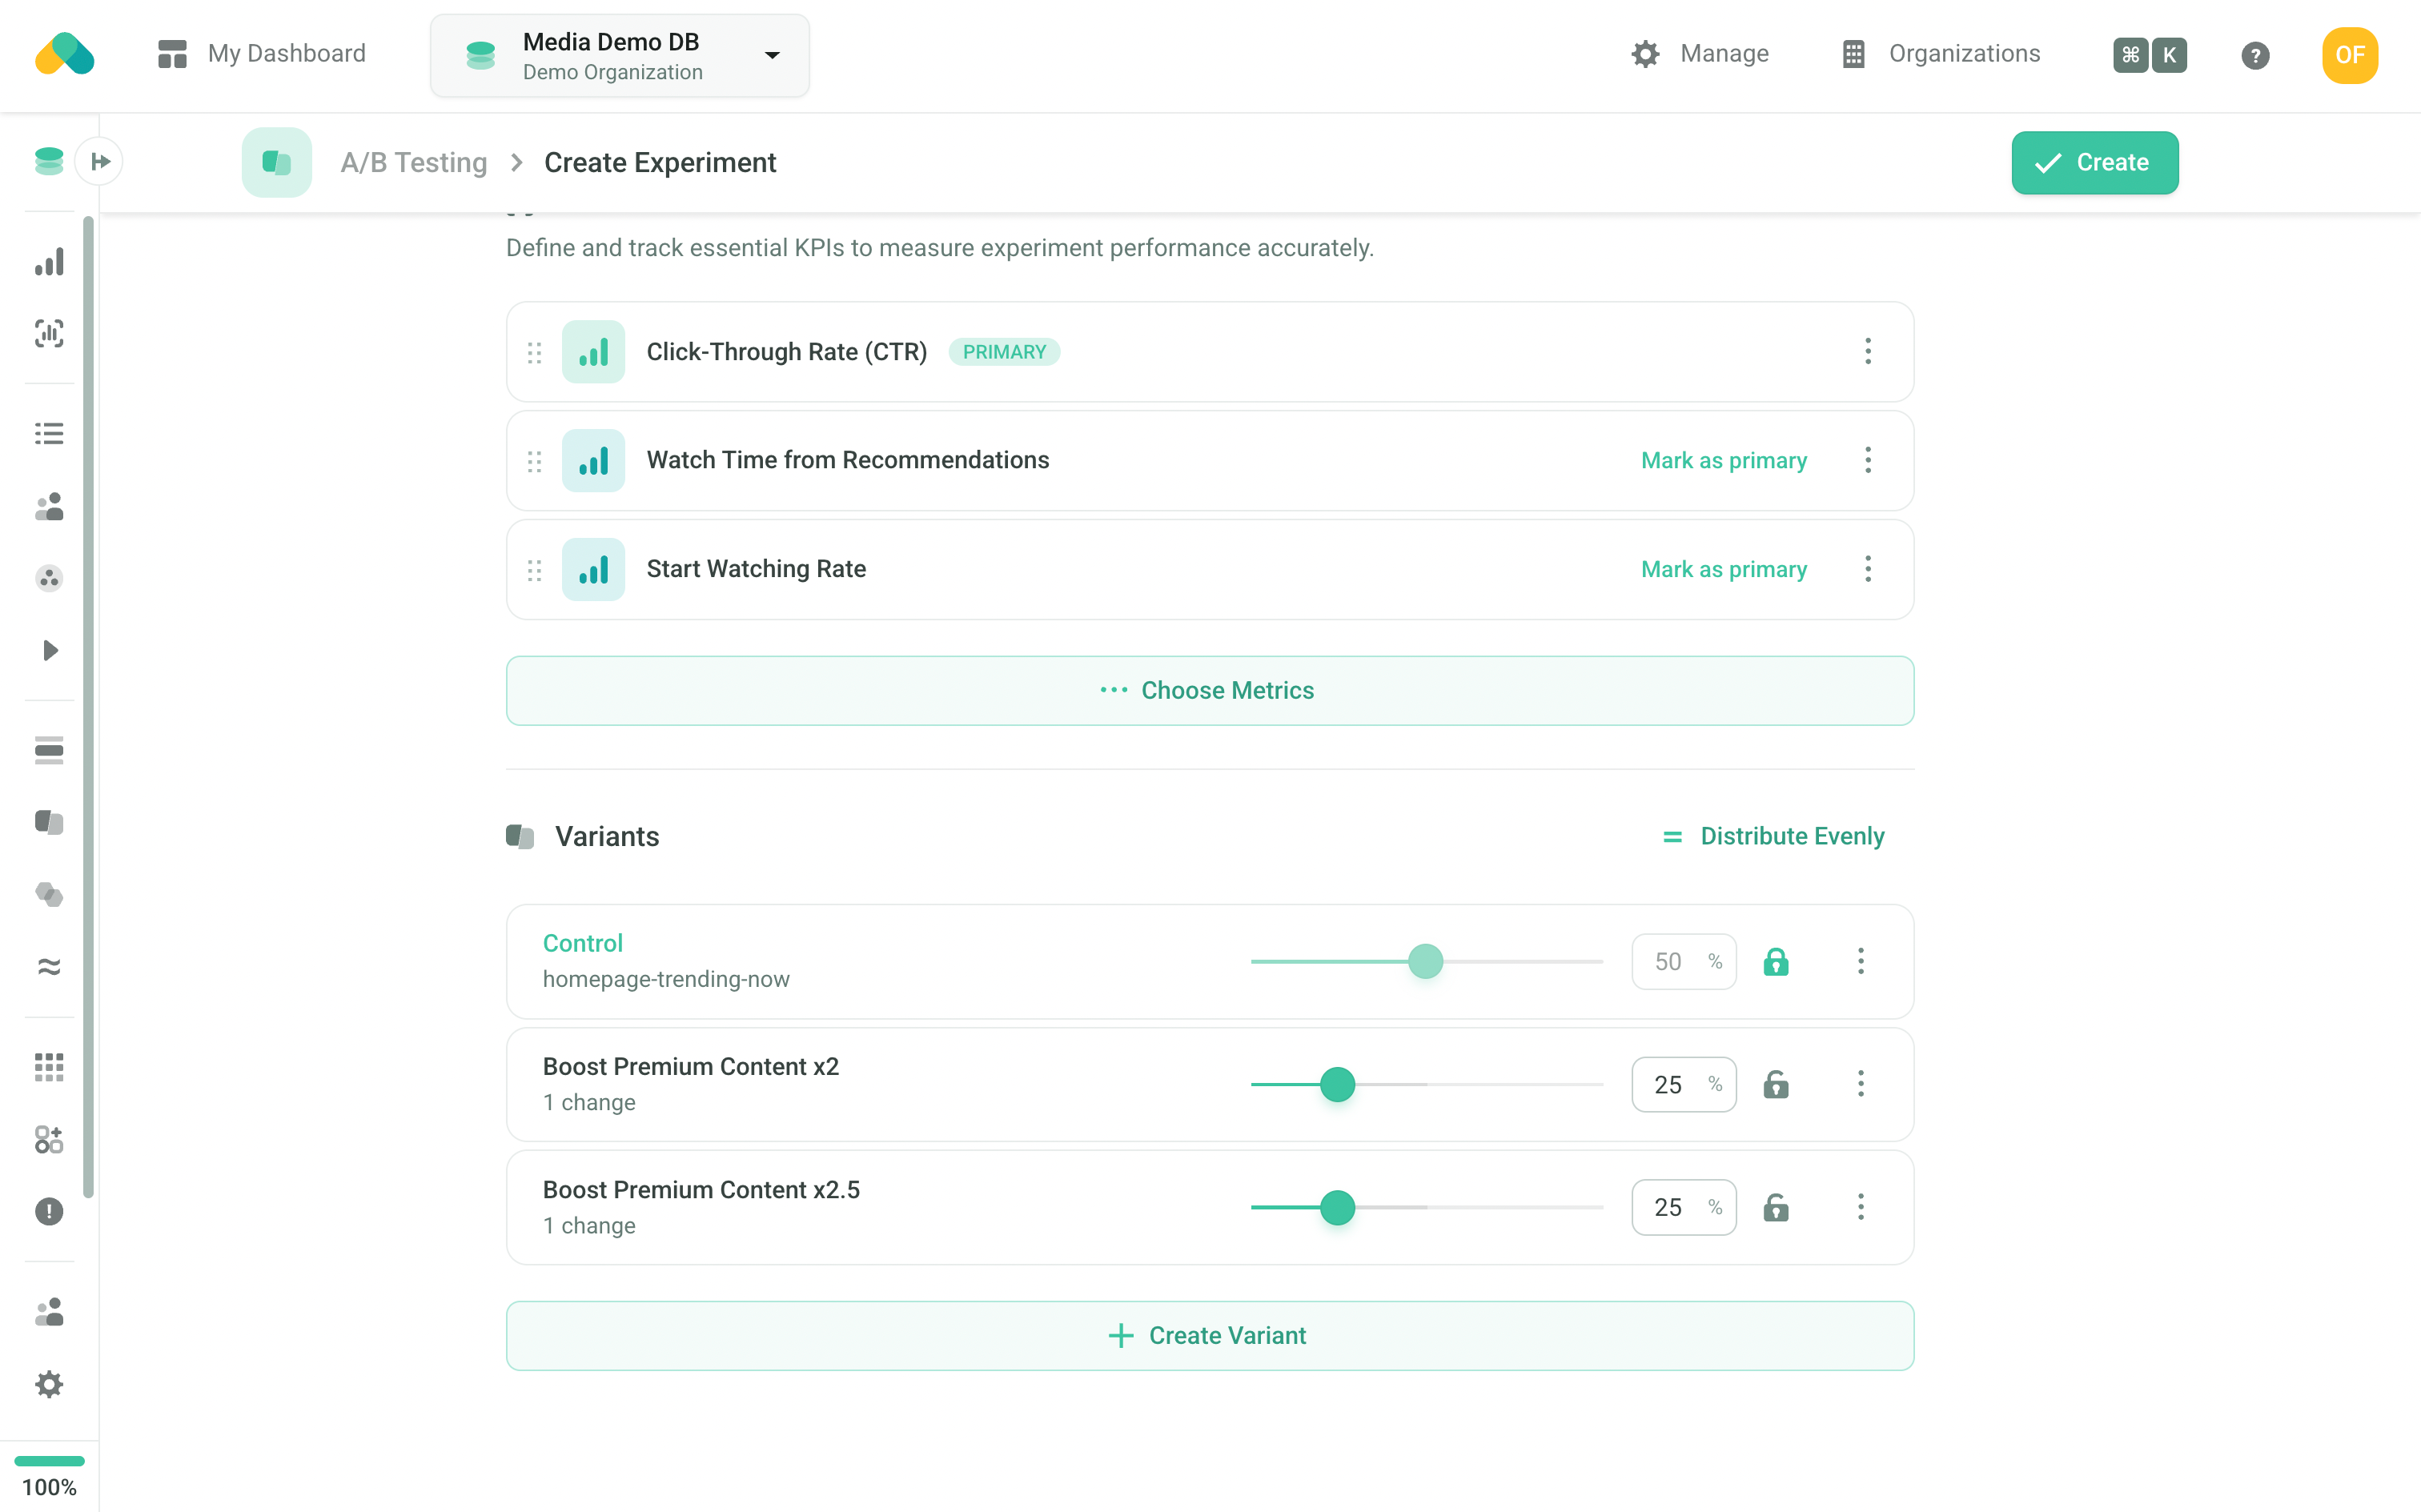
The sliders always add up to 100%, so changing one row moves the others. A row you have typed a percentage into is locked automatically, which keeps that value from being redistributed away when you adjust another Variant — click its lock icon to release it.
Report
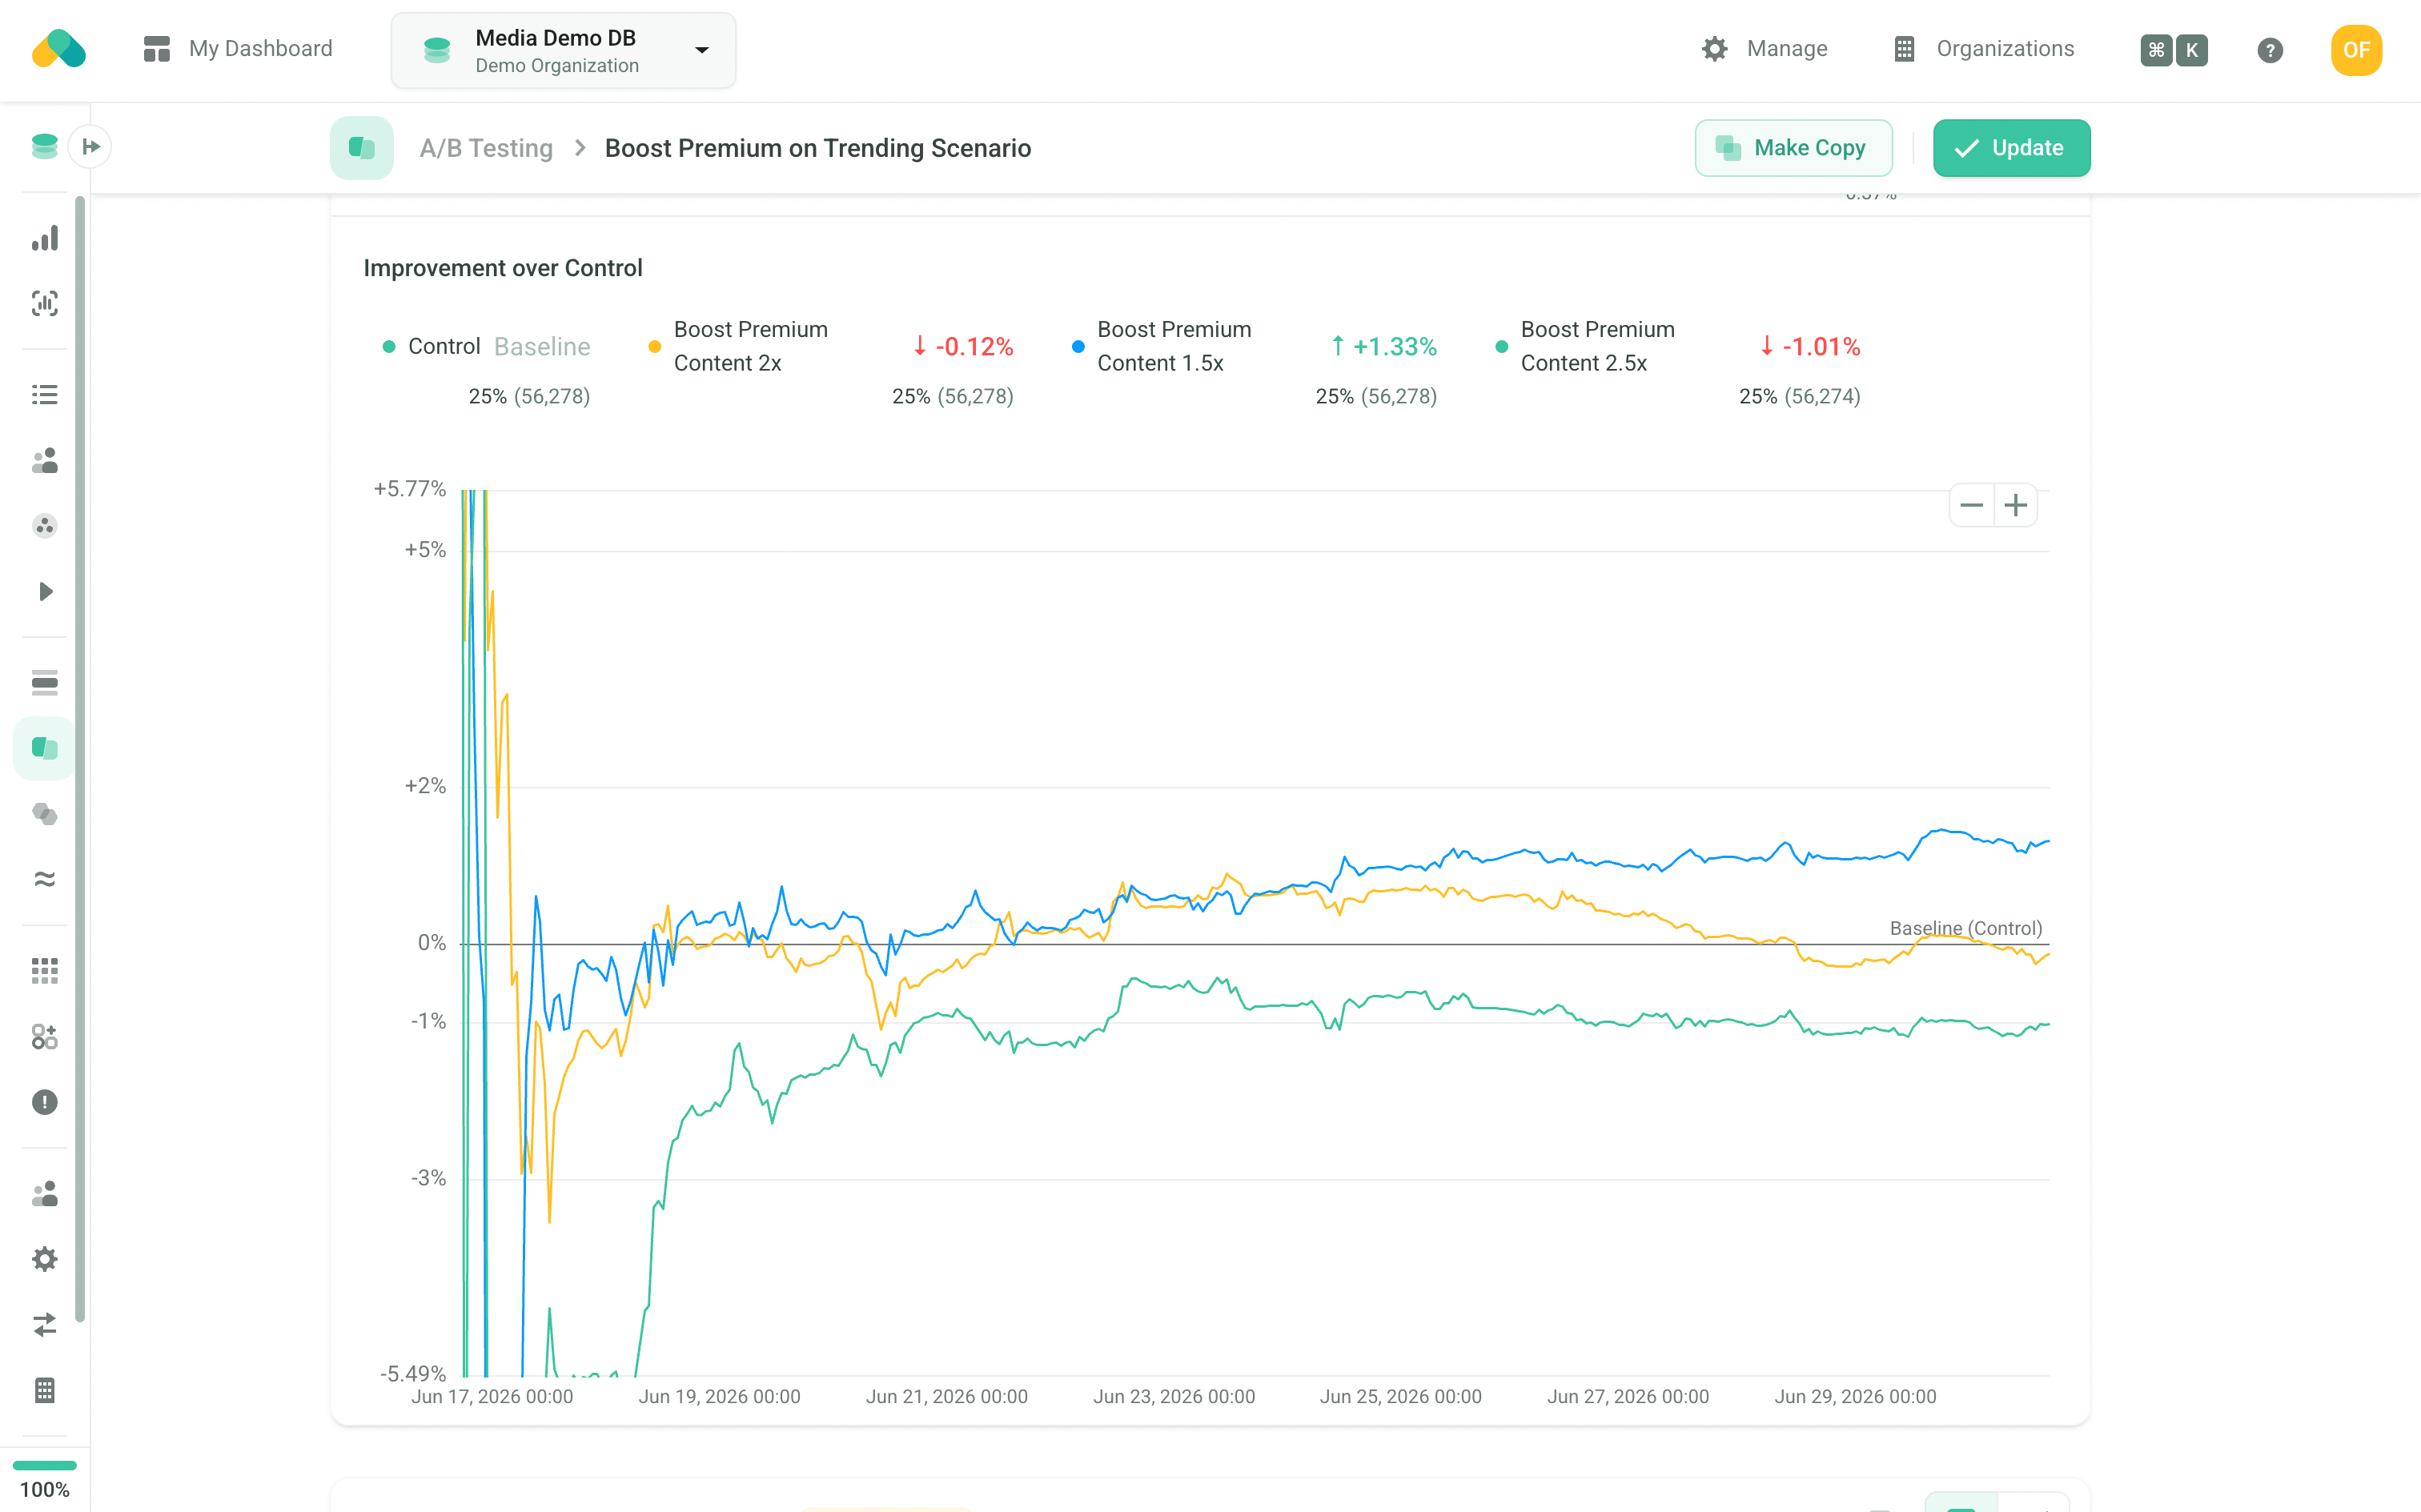
The report shows the effect of each Variant on every selected metric, including whether the results are statistically significant. For each metric, the table displays:
- Users — number of users in the Variant and their share of total traffic
- Improvement — change relative to the Control baseline
- Probability to be best — likelihood that this Variant outperforms all others
- Probability to beat baseline — likelihood that this Variant outperforms the Control
- Distribution — the mean and variance of the metric's value across users
The best-performing Variant is highlighted in the results.